Maltese vs Guatemalan Child Poverty Among Boys Under 16
COMPARE
Maltese
Guatemalan
Child Poverty Among Boys Under 16
Child Poverty Among Boys Under 16 Comparison
Maltese
Guatemalans
13.2%
CHILD POVERTY AMONG BOYS UNDER 16
99.9/ 100
METRIC RATING
16th/ 347
METRIC RANK
21.1%
CHILD POVERTY AMONG BOYS UNDER 16
0.0/ 100
METRIC RATING
301st/ 347
METRIC RANK
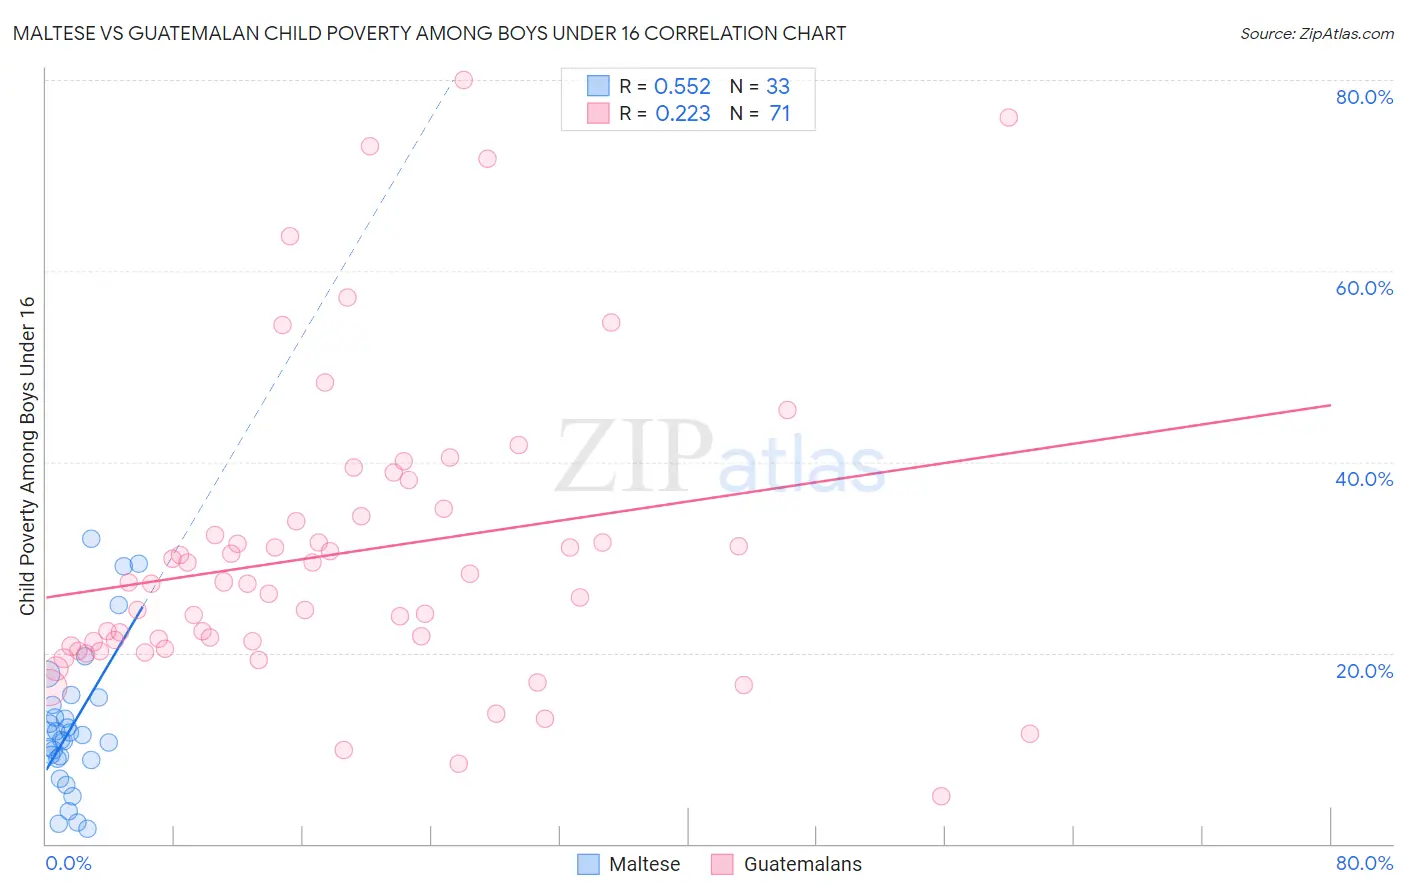
Maltese vs Guatemalan Child Poverty Among Boys Under 16 Correlation Chart
The statistical analysis conducted on geographies consisting of 125,189,723 people shows a substantial positive correlation between the proportion of Maltese and poverty level among boys under the age of 16 in the United States with a correlation coefficient (R) of 0.552 and weighted average of 13.2%. Similarly, the statistical analysis conducted on geographies consisting of 404,337,811 people shows a weak positive correlation between the proportion of Guatemalans and poverty level among boys under the age of 16 in the United States with a correlation coefficient (R) of 0.223 and weighted average of 21.1%, a difference of 60.5%.
Child Poverty Among Boys Under 16 Correlation Summary
| Measurement | Maltese | Guatemalan |
| Minimum | 1.6% | 5.0% |
| Maximum | 31.9% | 80.0% |
| Range | 30.3% | 75.0% |
| Mean | 12.5% | 30.4% |
| Median | 11.4% | 27.3% |
| Interquartile 25% (IQ1) | 8.8% | 20.7% |
| Interquartile 75% (IQ3) | 15.0% | 34.3% |
| Interquartile Range (IQR) | 6.2% | 13.6% |
| Standard Deviation (Sample) | 7.5% | 15.7% |
| Standard Deviation (Population) | 7.4% | 15.6% |
Similar Demographics by Child Poverty Among Boys Under 16
Demographics Similar to Maltese by Child Poverty Among Boys Under 16
In terms of child poverty among boys under 16, the demographic groups most similar to Maltese are Norwegian (13.2%, a difference of 0.090%), Immigrants from Japan (13.1%, a difference of 0.32%), Immigrants from Ireland (13.1%, a difference of 0.42%), Bulgarian (13.3%, a difference of 0.62%), and Bolivian (13.3%, a difference of 0.68%).
| Demographics | Rating | Rank | Child Poverty Among Boys Under 16 |
| Immigrants | Iran | 100.0 /100 | #9 | Exceptional 12.5% |
| Bhutanese | 100.0 /100 | #10 | Exceptional 12.6% |
| Immigrants | South Central Asia | 100.0 /100 | #11 | Exceptional 12.7% |
| Burmese | 99.9 /100 | #12 | Exceptional 13.0% |
| Immigrants | Korea | 99.9 /100 | #13 | Exceptional 13.0% |
| Immigrants | Ireland | 99.9 /100 | #14 | Exceptional 13.1% |
| Immigrants | Japan | 99.9 /100 | #15 | Exceptional 13.1% |
| Maltese | 99.9 /100 | #16 | Exceptional 13.2% |
| Norwegians | 99.9 /100 | #17 | Exceptional 13.2% |
| Bulgarians | 99.9 /100 | #18 | Exceptional 13.3% |
| Bolivians | 99.9 /100 | #19 | Exceptional 13.3% |
| Indians (Asian) | 99.9 /100 | #20 | Exceptional 13.3% |
| Immigrants | Eastern Asia | 99.9 /100 | #21 | Exceptional 13.3% |
| Tongans | 99.9 /100 | #22 | Exceptional 13.4% |
| Latvians | 99.9 /100 | #23 | Exceptional 13.4% |
Demographics Similar to Guatemalans by Child Poverty Among Boys Under 16
In terms of child poverty among boys under 16, the demographic groups most similar to Guatemalans are Somali (21.1%, a difference of 0.0%), Haitian (21.0%, a difference of 0.54%), Immigrants from Haiti (21.3%, a difference of 0.54%), Immigrants from Caribbean (21.0%, a difference of 0.59%), and Immigrants from Central America (21.3%, a difference of 0.60%).
| Demographics | Rating | Rank | Child Poverty Among Boys Under 16 |
| Immigrants | Bahamas | 0.0 /100 | #294 | Tragic 20.7% |
| Mexicans | 0.0 /100 | #295 | Tragic 20.7% |
| Indonesians | 0.0 /100 | #296 | Tragic 20.8% |
| Hispanics or Latinos | 0.0 /100 | #297 | Tragic 20.9% |
| Chippewa | 0.0 /100 | #298 | Tragic 21.0% |
| Immigrants | Caribbean | 0.0 /100 | #299 | Tragic 21.0% |
| Haitians | 0.0 /100 | #300 | Tragic 21.0% |
| Guatemalans | 0.0 /100 | #301 | Tragic 21.1% |
| Somalis | 0.0 /100 | #302 | Tragic 21.1% |
| Immigrants | Haiti | 0.0 /100 | #303 | Tragic 21.3% |
| Immigrants | Central America | 0.0 /100 | #304 | Tragic 21.3% |
| Kiowa | 0.0 /100 | #305 | Tragic 21.3% |
| Immigrants | Grenada | 0.0 /100 | #306 | Tragic 21.3% |
| Choctaw | 0.0 /100 | #307 | Tragic 21.3% |
| Immigrants | Mexico | 0.0 /100 | #308 | Tragic 21.5% |