Maltese vs Immigrants from Scotland Child Poverty Among Boys Under 16
COMPARE
Maltese
Immigrants from Scotland
Child Poverty Among Boys Under 16
Child Poverty Among Boys Under 16 Comparison
Maltese
Immigrants from Scotland
13.2%
CHILD POVERTY AMONG BOYS UNDER 16
99.9/ 100
METRIC RATING
16th/ 347
METRIC RANK
14.1%
CHILD POVERTY AMONG BOYS UNDER 16
99.4/ 100
METRIC RATING
45th/ 347
METRIC RANK
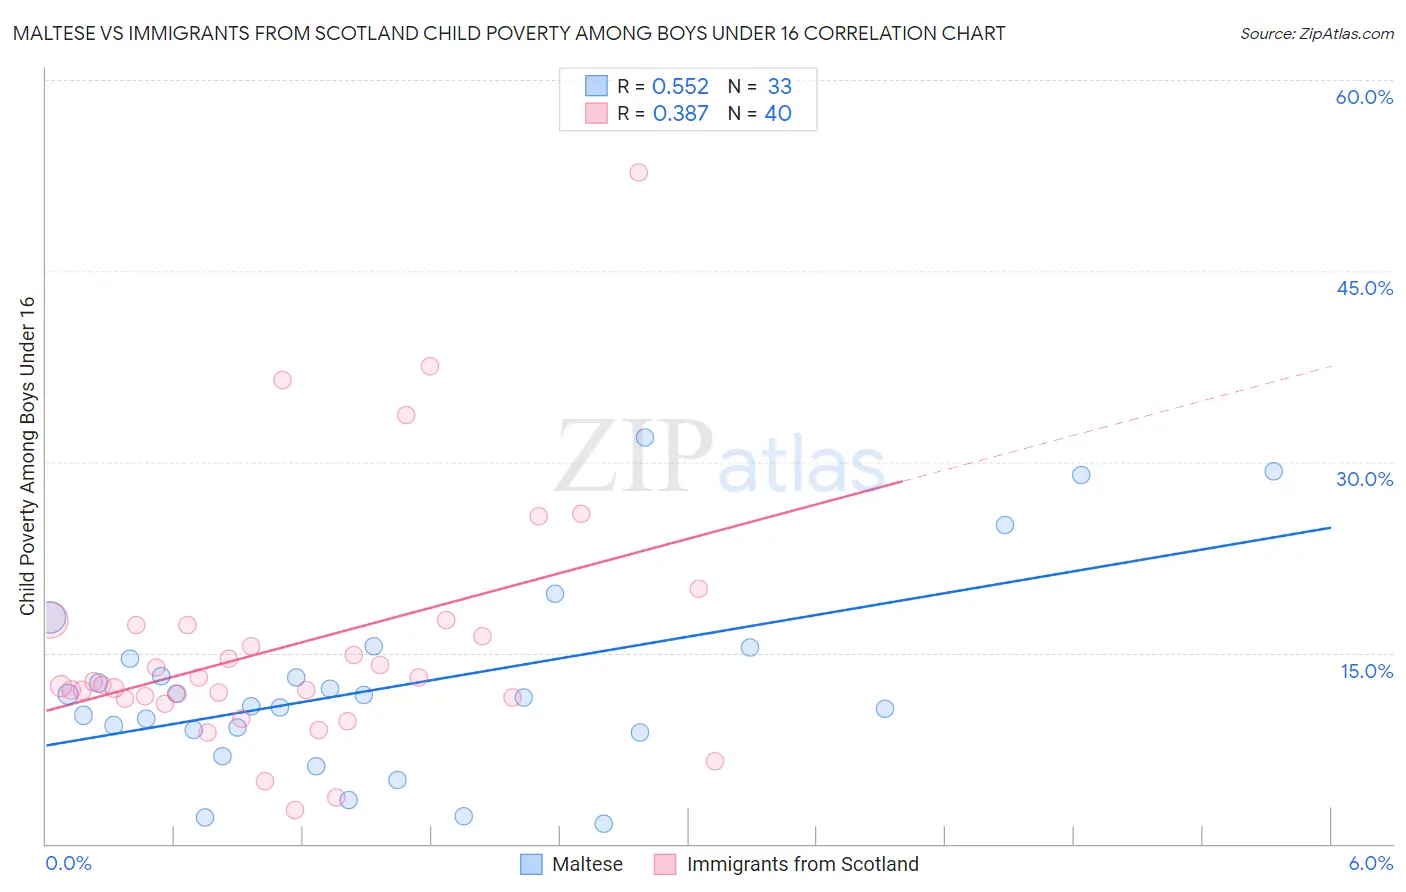
Maltese vs Immigrants from Scotland Child Poverty Among Boys Under 16 Correlation Chart
The statistical analysis conducted on geographies consisting of 125,189,723 people shows a substantial positive correlation between the proportion of Maltese and poverty level among boys under the age of 16 in the United States with a correlation coefficient (R) of 0.552 and weighted average of 13.2%. Similarly, the statistical analysis conducted on geographies consisting of 194,093,098 people shows a mild positive correlation between the proportion of Immigrants from Scotland and poverty level among boys under the age of 16 in the United States with a correlation coefficient (R) of 0.387 and weighted average of 14.1%, a difference of 6.8%.
Child Poverty Among Boys Under 16 Correlation Summary
| Measurement | Maltese | Immigrants from Scotland |
| Minimum | 1.6% | 2.6% |
| Maximum | 31.9% | 52.7% |
| Range | 30.3% | 50.1% |
| Mean | 12.5% | 15.7% |
| Median | 11.4% | 12.6% |
| Interquartile 25% (IQ1) | 8.8% | 11.5% |
| Interquartile 75% (IQ3) | 15.0% | 17.2% |
| Interquartile Range (IQR) | 6.2% | 5.7% |
| Standard Deviation (Sample) | 7.5% | 9.8% |
| Standard Deviation (Population) | 7.4% | 9.7% |
Similar Demographics by Child Poverty Among Boys Under 16
Demographics Similar to Maltese by Child Poverty Among Boys Under 16
In terms of child poverty among boys under 16, the demographic groups most similar to Maltese are Norwegian (13.2%, a difference of 0.090%), Immigrants from Japan (13.1%, a difference of 0.32%), Immigrants from Ireland (13.1%, a difference of 0.42%), Bulgarian (13.3%, a difference of 0.62%), and Bolivian (13.3%, a difference of 0.68%).
| Demographics | Rating | Rank | Child Poverty Among Boys Under 16 |
| Immigrants | Iran | 100.0 /100 | #9 | Exceptional 12.5% |
| Bhutanese | 100.0 /100 | #10 | Exceptional 12.6% |
| Immigrants | South Central Asia | 100.0 /100 | #11 | Exceptional 12.7% |
| Burmese | 99.9 /100 | #12 | Exceptional 13.0% |
| Immigrants | Korea | 99.9 /100 | #13 | Exceptional 13.0% |
| Immigrants | Ireland | 99.9 /100 | #14 | Exceptional 13.1% |
| Immigrants | Japan | 99.9 /100 | #15 | Exceptional 13.1% |
| Maltese | 99.9 /100 | #16 | Exceptional 13.2% |
| Norwegians | 99.9 /100 | #17 | Exceptional 13.2% |
| Bulgarians | 99.9 /100 | #18 | Exceptional 13.3% |
| Bolivians | 99.9 /100 | #19 | Exceptional 13.3% |
| Indians (Asian) | 99.9 /100 | #20 | Exceptional 13.3% |
| Immigrants | Eastern Asia | 99.9 /100 | #21 | Exceptional 13.3% |
| Tongans | 99.9 /100 | #22 | Exceptional 13.4% |
| Latvians | 99.9 /100 | #23 | Exceptional 13.4% |
Demographics Similar to Immigrants from Scotland by Child Poverty Among Boys Under 16
In terms of child poverty among boys under 16, the demographic groups most similar to Immigrants from Scotland are Estonian (14.1%, a difference of 0.090%), Greek (14.1%, a difference of 0.10%), Croatian (14.0%, a difference of 0.30%), Immigrants from Moldova (14.1%, a difference of 0.37%), and Immigrants from Indonesia (14.1%, a difference of 0.39%).
| Demographics | Rating | Rank | Child Poverty Among Boys Under 16 |
| Immigrants | Northern Europe | 99.6 /100 | #38 | Exceptional 13.9% |
| Immigrants | Australia | 99.6 /100 | #39 | Exceptional 13.9% |
| Immigrants | Asia | 99.6 /100 | #40 | Exceptional 13.9% |
| Lithuanians | 99.6 /100 | #41 | Exceptional 14.0% |
| Koreans | 99.6 /100 | #42 | Exceptional 14.0% |
| Croatians | 99.5 /100 | #43 | Exceptional 14.0% |
| Estonians | 99.4 /100 | #44 | Exceptional 14.1% |
| Immigrants | Scotland | 99.4 /100 | #45 | Exceptional 14.1% |
| Greeks | 99.4 /100 | #46 | Exceptional 14.1% |
| Immigrants | Moldova | 99.4 /100 | #47 | Exceptional 14.1% |
| Immigrants | Indonesia | 99.4 /100 | #48 | Exceptional 14.1% |
| Czechs | 99.3 /100 | #49 | Exceptional 14.1% |
| Italians | 99.2 /100 | #50 | Exceptional 14.2% |
| Immigrants | Greece | 99.2 /100 | #51 | Exceptional 14.2% |
| Laotians | 99.0 /100 | #52 | Exceptional 14.3% |