Maltese vs Immigrants from Zimbabwe Seniors Poverty Over the Age of 65
COMPARE
Maltese
Immigrants from Zimbabwe
Seniors Poverty Over the Age of 65
Seniors Poverty Over the Age of 65 Comparison
Maltese
Immigrants from Zimbabwe
9.1%
SENIORS POVERTY OVER THE AGE OF 65
99.9/ 100
METRIC RATING
11th/ 347
METRIC RANK
10.3%
SENIORS POVERTY OVER THE AGE OF 65
93.5/ 100
METRIC RATING
110th/ 347
METRIC RANK
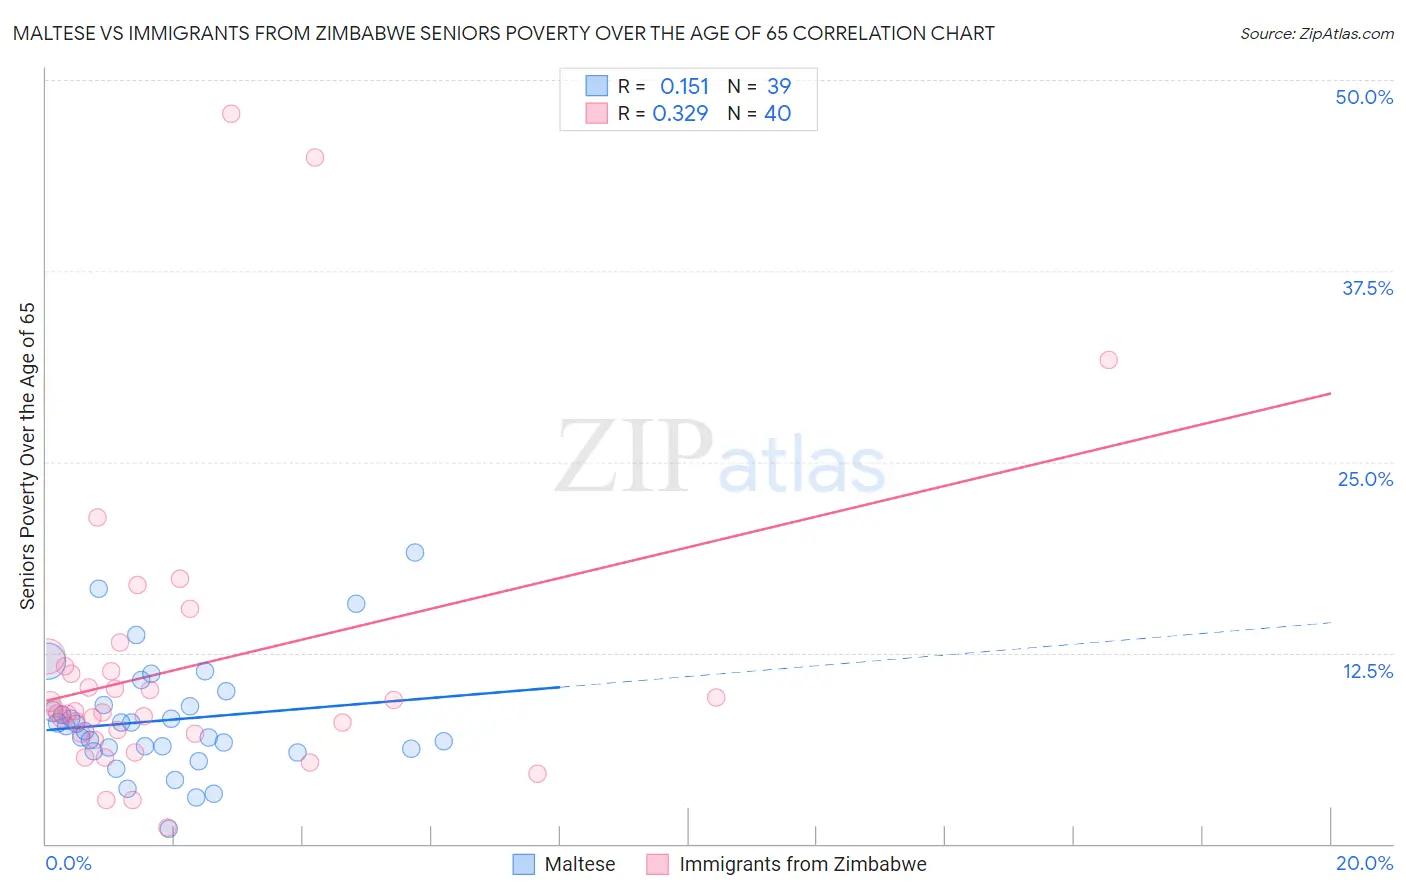
Maltese vs Immigrants from Zimbabwe Seniors Poverty Over the Age of 65 Correlation Chart
The statistical analysis conducted on geographies consisting of 126,339,773 people shows a poor positive correlation between the proportion of Maltese and poverty level among seniors over the age of 65 in the United States with a correlation coefficient (R) of 0.151 and weighted average of 9.1%. Similarly, the statistical analysis conducted on geographies consisting of 117,654,725 people shows a mild positive correlation between the proportion of Immigrants from Zimbabwe and poverty level among seniors over the age of 65 in the United States with a correlation coefficient (R) of 0.329 and weighted average of 10.3%, a difference of 13.0%.
Seniors Poverty Over the Age of 65 Correlation Summary
| Measurement | Maltese | Immigrants from Zimbabwe |
| Minimum | 1.00% | 1.0% |
| Maximum | 19.0% | 47.8% |
| Range | 18.0% | 46.7% |
| Mean | 8.1% | 11.5% |
| Median | 7.7% | 8.6% |
| Interquartile 25% (IQ1) | 6.2% | 7.2% |
| Interquartile 75% (IQ3) | 9.1% | 11.5% |
| Interquartile Range (IQR) | 2.9% | 4.3% |
| Standard Deviation (Sample) | 3.7% | 9.7% |
| Standard Deviation (Population) | 3.6% | 9.6% |
Similar Demographics by Seniors Poverty Over the Age of 65
Demographics Similar to Maltese by Seniors Poverty Over the Age of 65
In terms of seniors poverty over the age of 65, the demographic groups most similar to Maltese are Scandinavian (9.1%, a difference of 0.18%), Croatian (9.1%, a difference of 0.22%), Polish (9.1%, a difference of 0.26%), Dutch (9.1%, a difference of 0.32%), and Lithuanian (9.1%, a difference of 0.43%).
| Demographics | Rating | Rank | Seniors Poverty Over the Age of 65 |
| Swedes | 100.0 /100 | #4 | Exceptional 8.7% |
| Immigrants | India | 100.0 /100 | #5 | Exceptional 8.8% |
| Danes | 100.0 /100 | #6 | Exceptional 8.8% |
| Germans | 100.0 /100 | #7 | Exceptional 9.0% |
| Czechs | 100.0 /100 | #8 | Exceptional 9.0% |
| English | 100.0 /100 | #9 | Exceptional 9.1% |
| Lithuanians | 100.0 /100 | #10 | Exceptional 9.1% |
| Maltese | 99.9 /100 | #11 | Exceptional 9.1% |
| Scandinavians | 99.9 /100 | #12 | Exceptional 9.1% |
| Croatians | 99.9 /100 | #13 | Exceptional 9.1% |
| Poles | 99.9 /100 | #14 | Exceptional 9.1% |
| Dutch | 99.9 /100 | #15 | Exceptional 9.1% |
| Europeans | 99.9 /100 | #16 | Exceptional 9.2% |
| Scottish | 99.9 /100 | #17 | Exceptional 9.2% |
| Slovaks | 99.9 /100 | #18 | Exceptional 9.2% |
Demographics Similar to Immigrants from Zimbabwe by Seniors Poverty Over the Age of 65
In terms of seniors poverty over the age of 65, the demographic groups most similar to Immigrants from Zimbabwe are Immigrants from Belgium (10.3%, a difference of 0.030%), Immigrants from Korea (10.3%, a difference of 0.060%), Immigrants from Romania (10.3%, a difference of 0.090%), Syrian (10.3%, a difference of 0.14%), and Immigrants from Croatia (10.3%, a difference of 0.16%).
| Demographics | Rating | Rank | Seniors Poverty Over the Age of 65 |
| Icelanders | 94.4 /100 | #103 | Exceptional 10.3% |
| South Africans | 94.3 /100 | #104 | Exceptional 10.3% |
| Aleuts | 94.1 /100 | #105 | Exceptional 10.3% |
| Kenyans | 94.1 /100 | #106 | Exceptional 10.3% |
| Hawaiians | 93.9 /100 | #107 | Exceptional 10.3% |
| Immigrants | Croatia | 93.9 /100 | #108 | Exceptional 10.3% |
| Syrians | 93.8 /100 | #109 | Exceptional 10.3% |
| Immigrants | Zimbabwe | 93.5 /100 | #110 | Exceptional 10.3% |
| Immigrants | Belgium | 93.4 /100 | #111 | Exceptional 10.3% |
| Immigrants | Korea | 93.3 /100 | #112 | Exceptional 10.3% |
| Immigrants | Romania | 93.3 /100 | #113 | Exceptional 10.3% |
| Immigrants | Denmark | 92.7 /100 | #114 | Exceptional 10.3% |
| Immigrants | Italy | 92.6 /100 | #115 | Exceptional 10.3% |
| Pakistanis | 92.2 /100 | #116 | Exceptional 10.3% |
| Lebanese | 92.0 /100 | #117 | Exceptional 10.3% |