Maltese vs Cape Verdean Seniors Poverty Over the Age of 65
COMPARE
Maltese
Cape Verdean
Seniors Poverty Over the Age of 65
Seniors Poverty Over the Age of 65 Comparison
Maltese
Cape Verdeans
9.1%
SENIORS POVERTY OVER THE AGE OF 65
99.9/ 100
METRIC RATING
11th/ 347
METRIC RANK
14.7%
SENIORS POVERTY OVER THE AGE OF 65
0.0/ 100
METRIC RATING
319th/ 347
METRIC RANK
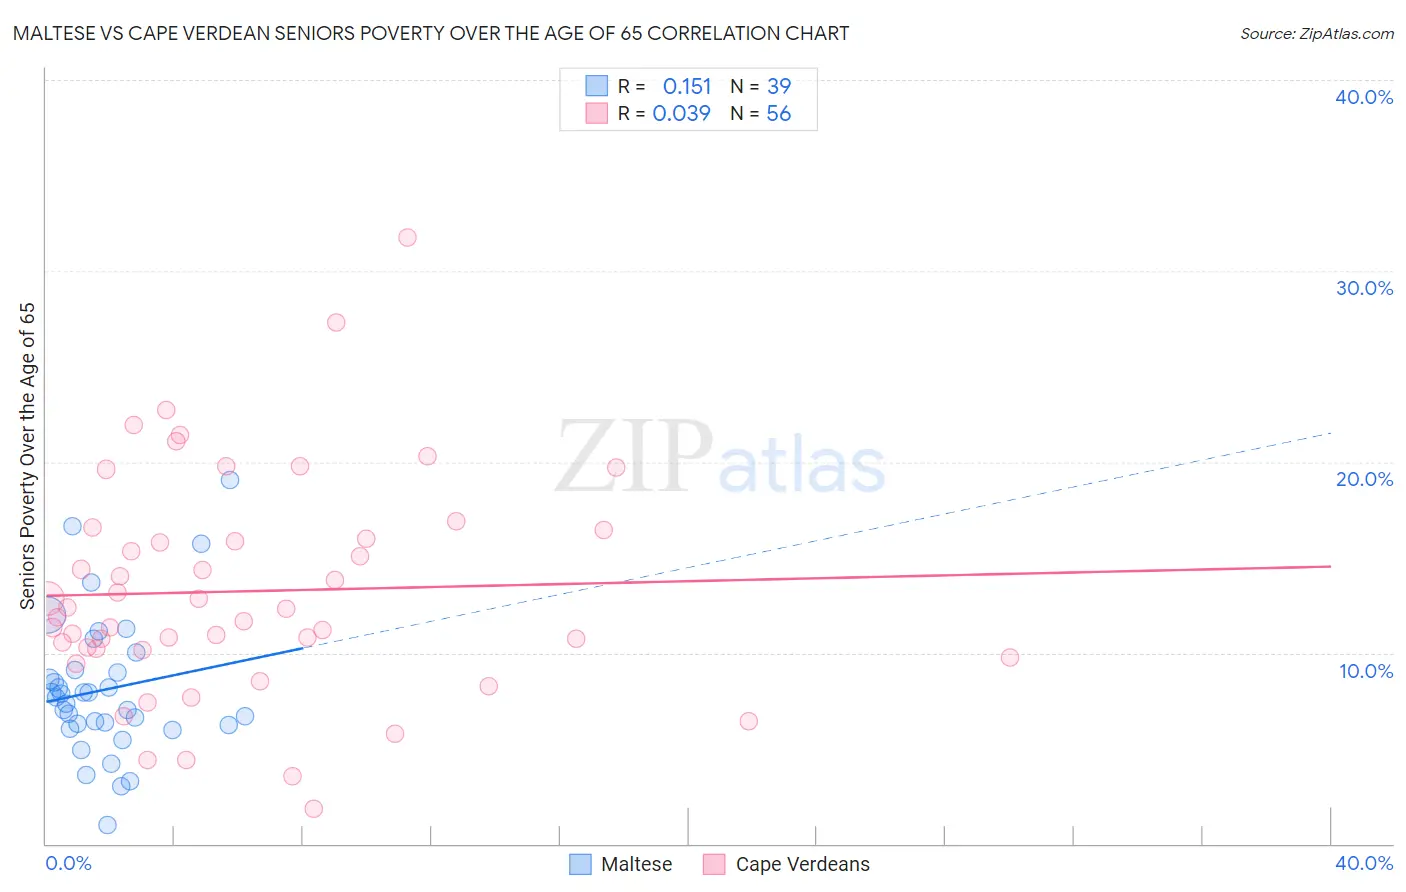
Maltese vs Cape Verdean Seniors Poverty Over the Age of 65 Correlation Chart
The statistical analysis conducted on geographies consisting of 126,339,773 people shows a poor positive correlation between the proportion of Maltese and poverty level among seniors over the age of 65 in the United States with a correlation coefficient (R) of 0.151 and weighted average of 9.1%. Similarly, the statistical analysis conducted on geographies consisting of 107,426,458 people shows no correlation between the proportion of Cape Verdeans and poverty level among seniors over the age of 65 in the United States with a correlation coefficient (R) of 0.039 and weighted average of 14.7%, a difference of 61.0%.
Seniors Poverty Over the Age of 65 Correlation Summary
| Measurement | Maltese | Cape Verdean |
| Minimum | 1.00% | 1.9% |
| Maximum | 19.0% | 31.7% |
| Range | 18.0% | 29.9% |
| Mean | 8.1% | 13.2% |
| Median | 7.7% | 12.1% |
| Interquartile 25% (IQ1) | 6.2% | 10.2% |
| Interquartile 75% (IQ3) | 9.1% | 16.2% |
| Interquartile Range (IQR) | 2.9% | 6.1% |
| Standard Deviation (Sample) | 3.7% | 5.8% |
| Standard Deviation (Population) | 3.6% | 5.8% |
Similar Demographics by Seniors Poverty Over the Age of 65
Demographics Similar to Maltese by Seniors Poverty Over the Age of 65
In terms of seniors poverty over the age of 65, the demographic groups most similar to Maltese are Scandinavian (9.1%, a difference of 0.18%), Croatian (9.1%, a difference of 0.22%), Polish (9.1%, a difference of 0.26%), Dutch (9.1%, a difference of 0.32%), and Lithuanian (9.1%, a difference of 0.43%).
| Demographics | Rating | Rank | Seniors Poverty Over the Age of 65 |
| Swedes | 100.0 /100 | #4 | Exceptional 8.7% |
| Immigrants | India | 100.0 /100 | #5 | Exceptional 8.8% |
| Danes | 100.0 /100 | #6 | Exceptional 8.8% |
| Germans | 100.0 /100 | #7 | Exceptional 9.0% |
| Czechs | 100.0 /100 | #8 | Exceptional 9.0% |
| English | 100.0 /100 | #9 | Exceptional 9.1% |
| Lithuanians | 100.0 /100 | #10 | Exceptional 9.1% |
| Maltese | 99.9 /100 | #11 | Exceptional 9.1% |
| Scandinavians | 99.9 /100 | #12 | Exceptional 9.1% |
| Croatians | 99.9 /100 | #13 | Exceptional 9.1% |
| Poles | 99.9 /100 | #14 | Exceptional 9.1% |
| Dutch | 99.9 /100 | #15 | Exceptional 9.1% |
| Europeans | 99.9 /100 | #16 | Exceptional 9.2% |
| Scottish | 99.9 /100 | #17 | Exceptional 9.2% |
| Slovaks | 99.9 /100 | #18 | Exceptional 9.2% |
Demographics Similar to Cape Verdeans by Seniors Poverty Over the Age of 65
In terms of seniors poverty over the age of 65, the demographic groups most similar to Cape Verdeans are Immigrants from Haiti (14.7%, a difference of 0.18%), Houma (14.7%, a difference of 0.39%), Immigrants from Barbados (14.8%, a difference of 0.78%), Yakama (14.8%, a difference of 0.93%), and Immigrants from Honduras (14.5%, a difference of 1.2%).
| Demographics | Rating | Rank | Seniors Poverty Over the Age of 65 |
| Hispanics or Latinos | 0.0 /100 | #312 | Tragic 14.3% |
| Barbadians | 0.0 /100 | #313 | Tragic 14.4% |
| Guyanese | 0.0 /100 | #314 | Tragic 14.4% |
| Immigrants | Ecuador | 0.0 /100 | #315 | Tragic 14.4% |
| Immigrants | Guyana | 0.0 /100 | #316 | Tragic 14.5% |
| Haitians | 0.0 /100 | #317 | Tragic 14.5% |
| Immigrants | Honduras | 0.0 /100 | #318 | Tragic 14.5% |
| Cape Verdeans | 0.0 /100 | #319 | Tragic 14.7% |
| Immigrants | Haiti | 0.0 /100 | #320 | Tragic 14.7% |
| Houma | 0.0 /100 | #321 | Tragic 14.7% |
| Immigrants | Barbados | 0.0 /100 | #322 | Tragic 14.8% |
| Yakama | 0.0 /100 | #323 | Tragic 14.8% |
| Nicaraguans | 0.0 /100 | #324 | Tragic 15.0% |
| Central American Indians | 0.0 /100 | #325 | Tragic 15.1% |
| Immigrants | Armenia | 0.0 /100 | #326 | Tragic 15.2% |