Immigrants from Colombia vs Immigrants from Zimbabwe Seniors Poverty Over the Age of 65

COMPARE

Immigrants from Colombia
Race
Ancestry
AfghanAfricanAlaska NativeAlaskan AthabascanAlbanianAleutAlsatianAmericanApacheArabArapahoArgentineanArmenianAssyrian/Chaldean/SyriacAustralianAustrianBahamianBangladeshiBarbadianBasqueBelgianBelizeanBermudanBhutaneseBlackfeetBolivianBrazilianBritishBritish West IndianBulgarianBurmeseCajunCambodianCanadianCape VerdeanCarpatho RusynCelticCentral AmericanCentral American IndianCherokeeCheyenneChickasawChileanChineseChippewaChoctawColombianColvilleComancheCosta RicanCreeCreekCroatianCrowCubanCypriotCzechCzechoslovakianDanishDelawareDominicanDutchDutch West IndianEastern EuropeanEcuadorianEgyptianEnglishEstonianEthiopianEuropeanFijianFilipinoFinnishFrenchFrench American IndianFrench CanadianGermanGerman RussianGhanaianGreekGuamanian/ChamorroGuatemalanGuyaneseHaitianHmongHonduranHopiHoumaHungarianIcelanderIndian (Asian)IndonesianInupiatIranianIraqiIrishIroquoisIsraeliItalianJamaicanJapaneseJordanianKenyanKiowaKoreanLaotianLatvianLebaneseLiberianLithuanianLumbeeLuxembourgerMacedonianMalaysianMalteseMarshalleseMenomineeMexicanMexican American IndianMongolianMoroccanNative HawaiianNavajoNepaleseNew ZealanderNicaraguanNigerianNorthern EuropeanNorwegianOkinawanOsageOttawaPaiutePakistaniPalestinianPanamanianParaguayanPennsylvania GermanPeruvianPimaPolishPortuguesePotawatomiPuebloPuerto RicanPuget Sound SalishRomanianRussianSalvadoranSamoanScandinavianScotch-IrishScottishSeminoleSenegaleseSerbianShoshoneSierra LeoneanSiouxSlavicSlovakSloveneSomaliSouth AfricanSouth AmericanSouth American IndianSoviet UnionSpaniardSpanishSpanish AmericanSpanish American IndianSri LankanSubsaharan AfricanSudaneseSwedishSwissSyrianTaiwaneseThaiTlingit-HaidaTohono O'OdhamTonganTrinidadian and TobagonianTsimshianTurkishU.S. Virgin IslanderUgandanUkrainianUruguayanUteVenezuelanVietnameseWelshWest IndianYakamaYaquiYugoslavianYumanYup'ikZimbabwean
Immigration
NonimmigrantsImmigrantsAfghanistanAfricaAlbaniaArgentinaArmeniaAsiaAustraliaAustriaBahamasBangladeshBarbadosBelarusBelgiumBelizeBoliviaBosnia and HerzegovinaBrazilBulgariaBurma/MyanmarCabo VerdeCambodiaCameroonCanadaCaribbeanCentral AmericaChileChinaColombiaCongoCosta RicaCroatiaCubaCzechoslovakiaDenmarkDominicaDominican RepublicEastern AfricaEastern AsiaEastern EuropeEcuadorEgyptEl SalvadorEnglandEritreaEthiopiaEuropeFijiFranceGermanyGhanaGreeceGrenadaGuatemalaGuyanaHaitiHondurasHong KongHungaryIndiaIndonesiaIranIraqIrelandIsraelItalyJamaicaJapanJordanKazakhstanKenyaKoreaKuwaitLaosLatin AmericaLatviaLebanonLiberiaLithuaniaMalaysiaMexicoMicronesiaMiddle AfricaMoldovaMoroccoNepalNetherlandsNicaraguaNigeriaNorth AmericaNorth MacedoniaNorthern AfricaNorthern EuropeNorwayOceaniaPakistanPanamaPeruPhilippinesPolandPortugalRomaniaRussiaSaudi ArabiaScotlandSenegalSerbiaSierra LeoneSingaporeSomaliaSouth AfricaSouth AmericaSouth Central AsiaSouth Eastern AsiaSouthern EuropeSpainSri LankaSt. Vincent and the GrenadinesSudanSwedenSwitzerlandSyriaTaiwanThailandTrinidad and TobagoTurkeyUgandaUkraineUruguayUzbekistanVenezuelaVietnamWest IndiesWestern AfricaWestern AsiaWestern EuropeYemenZaireAzores
Immigrants from Zimbabwe
Race
Ancestry
AfghanAfricanAlaska NativeAlaskan AthabascanAlbanianAleutAlsatianAmericanApacheArabArapahoArgentineanArmenianAssyrian/Chaldean/SyriacAustralianAustrianBahamianBangladeshiBarbadianBasqueBelgianBelizeanBermudanBhutaneseBlackfeetBolivianBrazilianBritishBritish West IndianBulgarianBurmeseCajunCambodianCanadianCape VerdeanCarpatho RusynCelticCentral AmericanCentral American IndianCherokeeCheyenneChickasawChileanChineseChippewaChoctawColombianColvilleComancheCosta RicanCreeCreekCroatianCrowCubanCypriotCzechCzechoslovakianDanishDelawareDominicanDutchDutch West IndianEastern EuropeanEcuadorianEgyptianEnglishEstonianEthiopianEuropeanFijianFilipinoFinnishFrenchFrench American IndianFrench CanadianGermanGerman RussianGhanaianGreekGuamanian/ChamorroGuatemalanGuyaneseHaitianHmongHonduranHopiHoumaHungarianIcelanderIndian (Asian)IndonesianInupiatIranianIraqiIrishIroquoisIsraeliItalianJamaicanJapaneseJordanianKenyanKiowaKoreanLaotianLatvianLebaneseLiberianLithuanianLumbeeLuxembourgerMacedonianMalaysianMalteseMarshalleseMenomineeMexicanMexican American IndianMongolianMoroccanNative HawaiianNavajoNepaleseNew ZealanderNicaraguanNigerianNorthern EuropeanNorwegianOkinawanOsageOttawaPaiutePakistaniPalestinianPanamanianParaguayanPennsylvania GermanPeruvianPimaPolishPortuguesePotawatomiPuebloPuerto RicanPuget Sound SalishRomanianRussianSalvadoranSamoanScandinavianScotch-IrishScottishSeminoleSenegaleseSerbianShoshoneSierra LeoneanSiouxSlavicSlovakSloveneSomaliSouth AfricanSouth AmericanSouth American IndianSoviet UnionSpaniardSpanishSpanish AmericanSpanish American IndianSri LankanSubsaharan AfricanSudaneseSwedishSwissSyrianTaiwaneseThaiTlingit-HaidaTohono O'OdhamTonganTrinidadian and TobagonianTsimshianTurkishU.S. Virgin IslanderUgandanUkrainianUruguayanUteVenezuelanVietnameseWelshWest IndianYakamaYaquiYugoslavianYumanYup'ikZimbabwean
Immigration
NonimmigrantsImmigrantsAfghanistanAfricaAlbaniaArgentinaArmeniaAsiaAustraliaAustriaBahamasBangladeshBarbadosBelarusBelgiumBelizeBoliviaBosnia and HerzegovinaBrazilBulgariaBurma/MyanmarCabo VerdeCambodiaCameroonCanadaCaribbeanCentral AmericaChileChinaCongoCosta RicaCroatiaCubaCzechoslovakiaDenmarkDominicaDominican RepublicEastern AfricaEastern AsiaEastern EuropeEcuadorEgyptEl SalvadorEnglandEritreaEthiopiaEuropeFijiFranceGermanyGhanaGreeceGrenadaGuatemalaGuyanaHaitiHondurasHong KongHungaryIndiaIndonesiaIranIraqIrelandIsraelItalyJamaicaJapanJordanKazakhstanKenyaKoreaKuwaitLaosLatin AmericaLatviaLebanonLiberiaLithuaniaMalaysiaMexicoMicronesiaMiddle AfricaMoldovaMoroccoNepalNetherlandsNicaraguaNigeriaNorth AmericaNorth MacedoniaNorthern AfricaNorthern EuropeNorwayOceaniaPakistanPanamaPeruPhilippinesPolandPortugalRomaniaRussiaSaudi ArabiaScotlandSenegalSerbiaSierra LeoneSingaporeSomaliaSouth AfricaSouth AmericaSouth Central AsiaSouth Eastern AsiaSouthern EuropeSpainSri LankaSt. Vincent and the GrenadinesSudanSwedenSwitzerlandSyriaTaiwanThailandTrinidad and TobagoTurkeyUgandaUkraineUruguayUzbekistanVenezuelaVietnamWest IndiesWestern AfricaWestern AsiaWestern EuropeYemenZaireZimbabweAzores
Seniors Poverty Over the Age of 65
Income
Poverty
Unemployment
Labor Participation
Family Structure
Vehicle Availability
Education Level
Disability

Seniors Poverty Over the Age of 65 Comparison

Immigrants from Colombia

Immigrants from Zimbabwe

Tragic
Exceptional
12.9%
SENIORS POVERTY OVER THE AGE OF 65
0.0/ 100
METRIC RATING
275th/ 347
METRIC RANK
10.3%
SENIORS POVERTY OVER THE AGE OF 65
93.5/ 100
METRIC RATING
110th/ 347
METRIC RANK

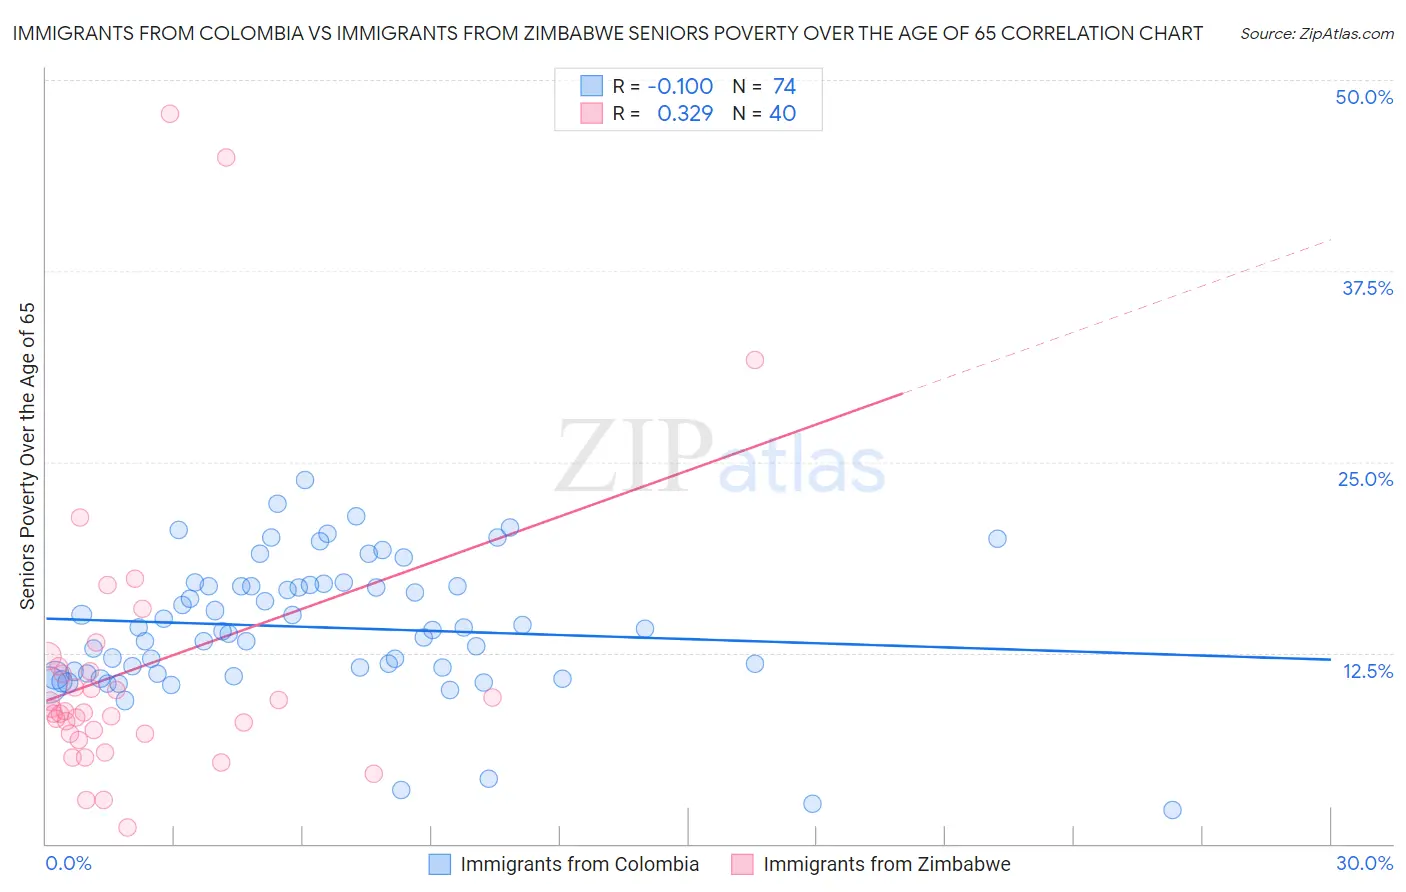
Immigrants from Colombia vs Immigrants from Zimbabwe Seniors Poverty Over the Age of 65 Correlation Chart

The statistical analysis conducted on geographies consisting of 377,503,020 people shows a slight negative correlation between the proportion of Immigrants from Colombia and poverty level among seniors over the age of 65 in the United States with a correlation coefficient (R) of -0.100 and weighted average of 12.9%. Similarly, the statistical analysis conducted on geographies consisting of 117,654,725 people shows a mild positive correlation between the proportion of Immigrants from Zimbabwe and poverty level among seniors over the age of 65 in the United States with a correlation coefficient (R) of 0.329 and weighted average of 10.3%, a difference of 25.4%.
Immigrants from Colombia vs Immigrants from Zimbabwe Seniors Poverty Over the Age of 65

Seniors Poverty Over the Age of 65 Correlation Summary

MeasurementImmigrants from ColombiaImmigrants from Zimbabwe
Minimum2.2%1.0%
Maximum23.8%47.8%
Range21.6%46.7%
Mean14.2%11.5%
Median14.0%8.6%
Interquartile 25% (IQ1)11.1%7.2%
Interquartile 75% (IQ3)16.9%11.5%
Interquartile Range (IQR)5.8%4.3%
Standard Deviation (Sample)4.4%9.7%
Standard Deviation (Population)4.4%9.6%

Similar Demographics by Seniors Poverty Over the Age of 65

Demographics Similar to Immigrants from Colombia by Seniors Poverty Over the Age of 65

In terms of seniors poverty over the age of 65, the demographic groups most similar to Immigrants from Colombia are Immigrants from the Azores (12.9%, a difference of 0.22%), Paiute (12.9%, a difference of 0.32%), Salvadoran (12.8%, a difference of 0.67%), Kiowa (12.8%, a difference of 0.92%), and Immigrants from Uruguay (12.8%, a difference of 1.0%).
DemographicsRating | RankSeniors Poverty Over the Age of 65
Immigrants | Somalia
0.1
/100
|
#268
Tragic
12.6%
Immigrants | Venezuela
0.1
/100
|
#269
Tragic
12.7%
Immigrants | South America
0.1
/100
|
#270
Tragic
12.7%
Immigrants | Ghana
0.1
/100
|
#271
Tragic
12.8%
Immigrants | Uruguay
0.1
/100
|
#272
Tragic
12.8%
Kiowa
0.0
/100
|
#273
Tragic
12.8%
Salvadorans
0.0
/100
|
#274
Tragic
12.8%
Immigrants | Colombia
0.0
/100
|
#275
Tragic
12.9%
Immigrants | Azores
0.0
/100
|
#276
Tragic
12.9%
Paiute
0.0
/100
|
#277
Tragic
12.9%
Immigrants | Bahamas
0.0
/100
|
#278
Tragic
13.0%
Mexicans
0.0
/100
|
#279
Tragic
13.1%
Yuman
0.0
/100
|
#280
Tragic
13.1%
Immigrants | El Salvador
0.0
/100
|
#281
Tragic
13.1%
Senegalese
0.0
/100
|
#282
Tragic
13.3%

Demographics Similar to Immigrants from Zimbabwe by Seniors Poverty Over the Age of 65

In terms of seniors poverty over the age of 65, the demographic groups most similar to Immigrants from Zimbabwe are Immigrants from Belgium (10.3%, a difference of 0.030%), Immigrants from Korea (10.3%, a difference of 0.060%), Immigrants from Romania (10.3%, a difference of 0.090%), Syrian (10.3%, a difference of 0.14%), and Immigrants from Croatia (10.3%, a difference of 0.16%).
DemographicsRating | RankSeniors Poverty Over the Age of 65
Icelanders
94.4
/100
|
#103
Exceptional
10.3%
South Africans
94.3
/100
|
#104
Exceptional
10.3%
Aleuts
94.1
/100
|
#105
Exceptional
10.3%
Kenyans
94.1
/100
|
#106
Exceptional
10.3%
Hawaiians
93.9
/100
|
#107
Exceptional
10.3%
Immigrants | Croatia
93.9
/100
|
#108
Exceptional
10.3%
Syrians
93.8
/100
|
#109
Exceptional
10.3%
Immigrants | Zimbabwe
93.5
/100
|
#110
Exceptional
10.3%
Immigrants | Belgium
93.4
/100
|
#111
Exceptional
10.3%
Immigrants | Korea
93.3
/100
|
#112
Exceptional
10.3%
Immigrants | Romania
93.3
/100
|
#113
Exceptional
10.3%
Immigrants | Denmark
92.7
/100
|
#114
Exceptional
10.3%
Immigrants | Italy
92.6
/100
|
#115
Exceptional
10.3%
Pakistanis
92.2
/100
|
#116
Exceptional
10.3%
Lebanese
92.0
/100
|
#117
Exceptional
10.3%