Malaysian vs Immigrants from Iraq Single Mother Poverty
COMPARE
Malaysian
Immigrants from Iraq
Single Mother Poverty
Single Mother Poverty Comparison
Malaysians
Immigrants from Iraq
29.7%
SINGLE MOTHER POVERTY
17.4/ 100
METRIC RATING
202nd/ 347
METRIC RANK
27.9%
SINGLE MOTHER POVERTY
97.3/ 100
METRIC RATING
96th/ 347
METRIC RANK
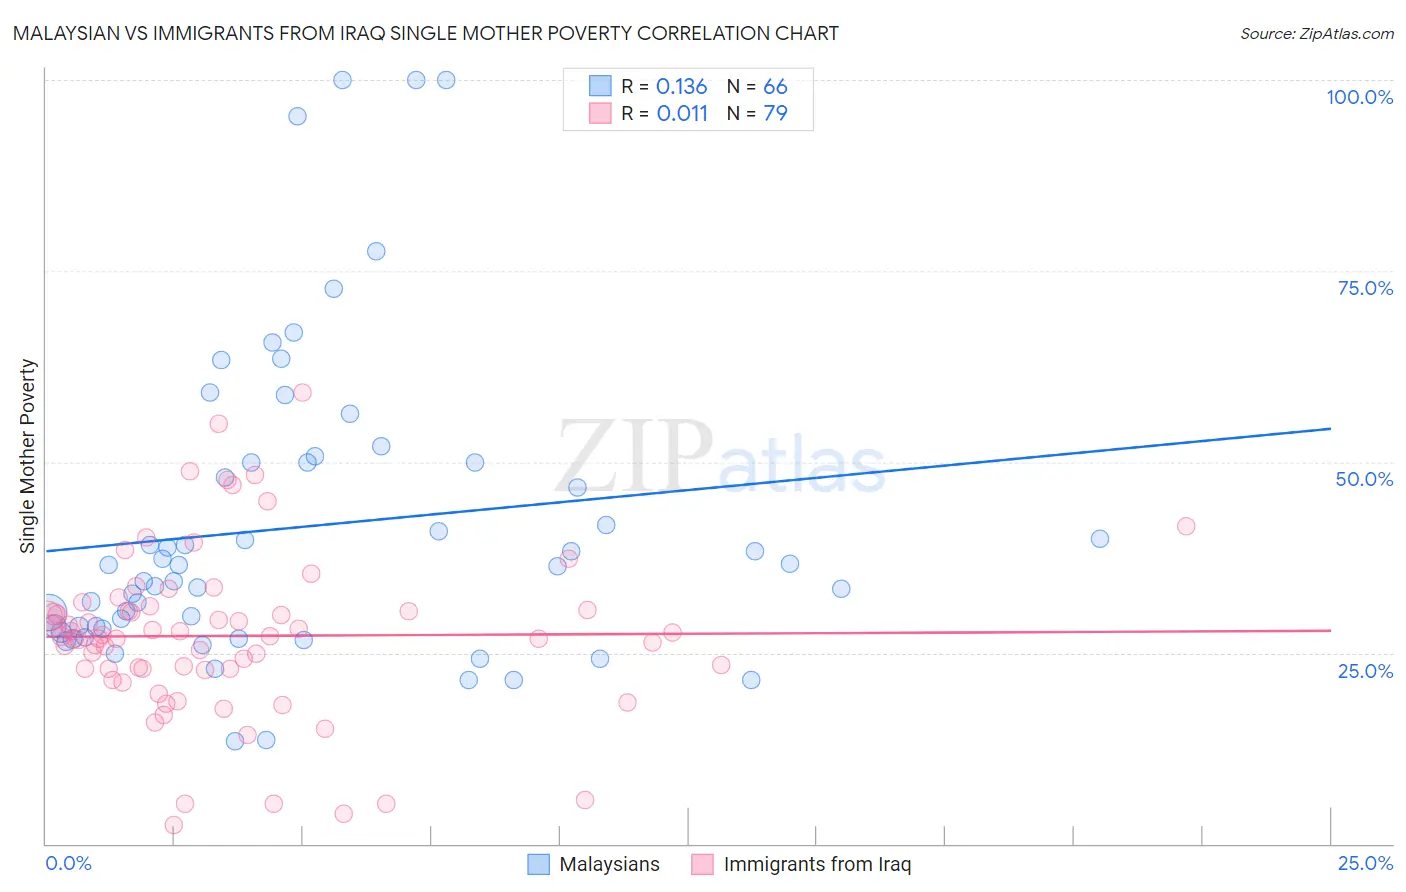
Malaysian vs Immigrants from Iraq Single Mother Poverty Correlation Chart
The statistical analysis conducted on geographies consisting of 223,567,938 people shows a poor positive correlation between the proportion of Malaysians and poverty level among single mothers in the United States with a correlation coefficient (R) of 0.136 and weighted average of 29.7%. Similarly, the statistical analysis conducted on geographies consisting of 192,547,231 people shows no correlation between the proportion of Immigrants from Iraq and poverty level among single mothers in the United States with a correlation coefficient (R) of 0.011 and weighted average of 27.9%, a difference of 6.4%.
Single Mother Poverty Correlation Summary
| Measurement | Malaysian | Immigrants from Iraq |
| Minimum | 13.4% | 2.4% |
| Maximum | 100.0% | 59.0% |
| Range | 86.6% | 56.6% |
| Mean | 41.5% | 27.2% |
| Median | 36.4% | 27.1% |
| Interquartile 25% (IQ1) | 28.2% | 22.9% |
| Interquartile 75% (IQ3) | 50.0% | 30.6% |
| Interquartile Range (IQR) | 21.8% | 7.8% |
| Standard Deviation (Sample) | 20.1% | 10.9% |
| Standard Deviation (Population) | 20.0% | 10.8% |
Similar Demographics by Single Mother Poverty
Demographics Similar to Malaysians by Single Mother Poverty
In terms of single mother poverty, the demographic groups most similar to Malaysians are Swiss (29.7%, a difference of 0.020%), Immigrants (29.7%, a difference of 0.070%), Belgian (29.7%, a difference of 0.10%), Czechoslovakian (29.7%, a difference of 0.11%), and Immigrants from Haiti (29.7%, a difference of 0.14%).
| Demographics | Rating | Rank | Single Mother Poverty |
| Slavs | 24.5 /100 | #195 | Fair 29.6% |
| Spanish American Indians | 23.4 /100 | #196 | Fair 29.6% |
| Immigrants | Jamaica | 22.0 /100 | #197 | Fair 29.6% |
| Trinidadians and Tobagonians | 21.7 /100 | #198 | Fair 29.6% |
| Cubans | 20.8 /100 | #199 | Fair 29.6% |
| Panamanians | 20.0 /100 | #200 | Fair 29.6% |
| Belgians | 18.8 /100 | #201 | Poor 29.7% |
| Malaysians | 17.4 /100 | #202 | Poor 29.7% |
| Swiss | 17.2 /100 | #203 | Poor 29.7% |
| Immigrants | Immigrants | 16.6 /100 | #204 | Poor 29.7% |
| Czechoslovakians | 16.1 /100 | #205 | Poor 29.7% |
| Immigrants | Haiti | 15.8 /100 | #206 | Poor 29.7% |
| Immigrants | Panama | 15.5 /100 | #207 | Poor 29.8% |
| Immigrants | Guyana | 14.7 /100 | #208 | Poor 29.8% |
| Irish | 13.9 /100 | #209 | Poor 29.8% |
Demographics Similar to Immigrants from Iraq by Single Mother Poverty
In terms of single mother poverty, the demographic groups most similar to Immigrants from Iraq are Immigrants from Brazil (27.9%, a difference of 0.040%), Immigrants from Nepal (27.9%, a difference of 0.050%), Immigrants from Netherlands (27.9%, a difference of 0.060%), Chilean (27.9%, a difference of 0.10%), and Zimbabwean (27.9%, a difference of 0.11%).
| Demographics | Rating | Rank | Single Mother Poverty |
| Immigrants | Ethiopia | 98.4 /100 | #89 | Exceptional 27.7% |
| Immigrants | France | 98.2 /100 | #90 | Exceptional 27.8% |
| Immigrants | Albania | 98.0 /100 | #91 | Exceptional 27.8% |
| Estonians | 97.9 /100 | #92 | Exceptional 27.8% |
| Romanians | 97.8 /100 | #93 | Exceptional 27.8% |
| Albanians | 97.6 /100 | #94 | Exceptional 27.9% |
| Chileans | 97.5 /100 | #95 | Exceptional 27.9% |
| Immigrants | Iraq | 97.3 /100 | #96 | Exceptional 27.9% |
| Immigrants | Brazil | 97.2 /100 | #97 | Exceptional 27.9% |
| Immigrants | Nepal | 97.2 /100 | #98 | Exceptional 27.9% |
| Immigrants | Netherlands | 97.2 /100 | #99 | Exceptional 27.9% |
| Zimbabweans | 97.1 /100 | #100 | Exceptional 27.9% |
| Pakistanis | 96.9 /100 | #101 | Exceptional 28.0% |
| Immigrants | Croatia | 96.7 /100 | #102 | Exceptional 28.0% |
| Immigrants | Northern Africa | 96.6 /100 | #103 | Exceptional 28.0% |