Malaysian vs Immigrants from Spain Single Mother Poverty
COMPARE
Malaysian
Immigrants from Spain
Single Mother Poverty
Single Mother Poverty Comparison
Malaysians
Immigrants from Spain
29.7%
SINGLE MOTHER POVERTY
17.4/ 100
METRIC RATING
202nd/ 347
METRIC RANK
28.4%
SINGLE MOTHER POVERTY
89.2/ 100
METRIC RATING
135th/ 347
METRIC RANK
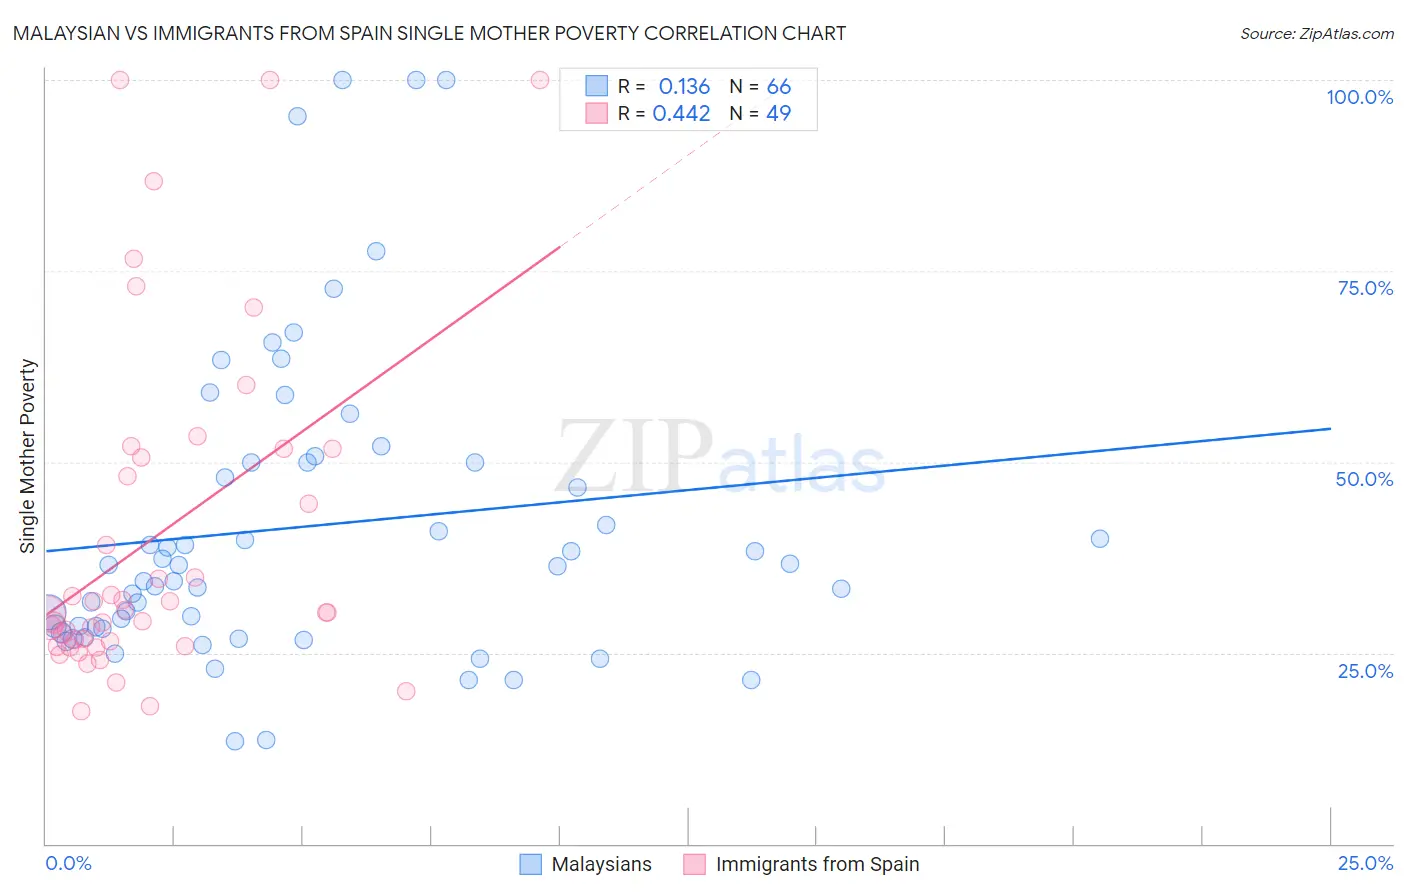
Malaysian vs Immigrants from Spain Single Mother Poverty Correlation Chart
The statistical analysis conducted on geographies consisting of 223,567,938 people shows a poor positive correlation between the proportion of Malaysians and poverty level among single mothers in the United States with a correlation coefficient (R) of 0.136 and weighted average of 29.7%. Similarly, the statistical analysis conducted on geographies consisting of 235,531,441 people shows a moderate positive correlation between the proportion of Immigrants from Spain and poverty level among single mothers in the United States with a correlation coefficient (R) of 0.442 and weighted average of 28.4%, a difference of 4.5%.
Single Mother Poverty Correlation Summary
| Measurement | Malaysian | Immigrants from Spain |
| Minimum | 13.4% | 17.3% |
| Maximum | 100.0% | 100.0% |
| Range | 86.6% | 82.7% |
| Mean | 41.5% | 40.1% |
| Median | 36.4% | 30.2% |
| Interquartile 25% (IQ1) | 28.2% | 26.2% |
| Interquartile 75% (IQ3) | 50.0% | 51.1% |
| Interquartile Range (IQR) | 21.8% | 25.0% |
| Standard Deviation (Sample) | 20.1% | 22.0% |
| Standard Deviation (Population) | 20.0% | 21.8% |
Similar Demographics by Single Mother Poverty
Demographics Similar to Malaysians by Single Mother Poverty
In terms of single mother poverty, the demographic groups most similar to Malaysians are Swiss (29.7%, a difference of 0.020%), Immigrants (29.7%, a difference of 0.070%), Belgian (29.7%, a difference of 0.10%), Czechoslovakian (29.7%, a difference of 0.11%), and Immigrants from Haiti (29.7%, a difference of 0.14%).
| Demographics | Rating | Rank | Single Mother Poverty |
| Slavs | 24.5 /100 | #195 | Fair 29.6% |
| Spanish American Indians | 23.4 /100 | #196 | Fair 29.6% |
| Immigrants | Jamaica | 22.0 /100 | #197 | Fair 29.6% |
| Trinidadians and Tobagonians | 21.7 /100 | #198 | Fair 29.6% |
| Cubans | 20.8 /100 | #199 | Fair 29.6% |
| Panamanians | 20.0 /100 | #200 | Fair 29.6% |
| Belgians | 18.8 /100 | #201 | Poor 29.7% |
| Malaysians | 17.4 /100 | #202 | Poor 29.7% |
| Swiss | 17.2 /100 | #203 | Poor 29.7% |
| Immigrants | Immigrants | 16.6 /100 | #204 | Poor 29.7% |
| Czechoslovakians | 16.1 /100 | #205 | Poor 29.7% |
| Immigrants | Haiti | 15.8 /100 | #206 | Poor 29.7% |
| Immigrants | Panama | 15.5 /100 | #207 | Poor 29.8% |
| Immigrants | Guyana | 14.7 /100 | #208 | Poor 29.8% |
| Irish | 13.9 /100 | #209 | Poor 29.8% |
Demographics Similar to Immigrants from Spain by Single Mother Poverty
In terms of single mother poverty, the demographic groups most similar to Immigrants from Spain are Immigrants from Southern Europe (28.4%, a difference of 0.0%), Immigrants from Morocco (28.4%, a difference of 0.030%), Swedish (28.4%, a difference of 0.030%), Native Hawaiian (28.4%, a difference of 0.040%), and Immigrants from Canada (28.4%, a difference of 0.040%).
| Demographics | Rating | Rank | Single Mother Poverty |
| Immigrants | England | 90.5 /100 | #128 | Exceptional 28.4% |
| South Americans | 90.4 /100 | #129 | Exceptional 28.4% |
| Norwegians | 90.4 /100 | #130 | Exceptional 28.4% |
| Immigrants | Austria | 90.3 /100 | #131 | Exceptional 28.4% |
| Immigrants | Morocco | 89.5 /100 | #132 | Excellent 28.4% |
| Swedes | 89.4 /100 | #133 | Excellent 28.4% |
| Immigrants | Southern Europe | 89.2 /100 | #134 | Excellent 28.4% |
| Immigrants | Spain | 89.2 /100 | #135 | Excellent 28.4% |
| Native Hawaiians | 88.9 /100 | #136 | Excellent 28.4% |
| Immigrants | Canada | 88.9 /100 | #137 | Excellent 28.4% |
| Immigrants | Belgium | 88.5 /100 | #138 | Excellent 28.5% |
| Samoans | 88.1 /100 | #139 | Excellent 28.5% |
| Immigrants | Colombia | 88.0 /100 | #140 | Excellent 28.5% |
| Danes | 87.1 /100 | #141 | Excellent 28.5% |
| South Africans | 86.6 /100 | #142 | Excellent 28.5% |