Ugandan vs Moroccan Single Father Poverty
COMPARE
Ugandan
Moroccan
Single Father Poverty
Single Father Poverty Comparison
Ugandans
Moroccans
16.3%
SINGLE FATHER POVERTY
55.9/ 100
METRIC RATING
162nd/ 347
METRIC RANK
17.0%
SINGLE FATHER POVERTY
2.1/ 100
METRIC RATING
242nd/ 347
METRIC RANK
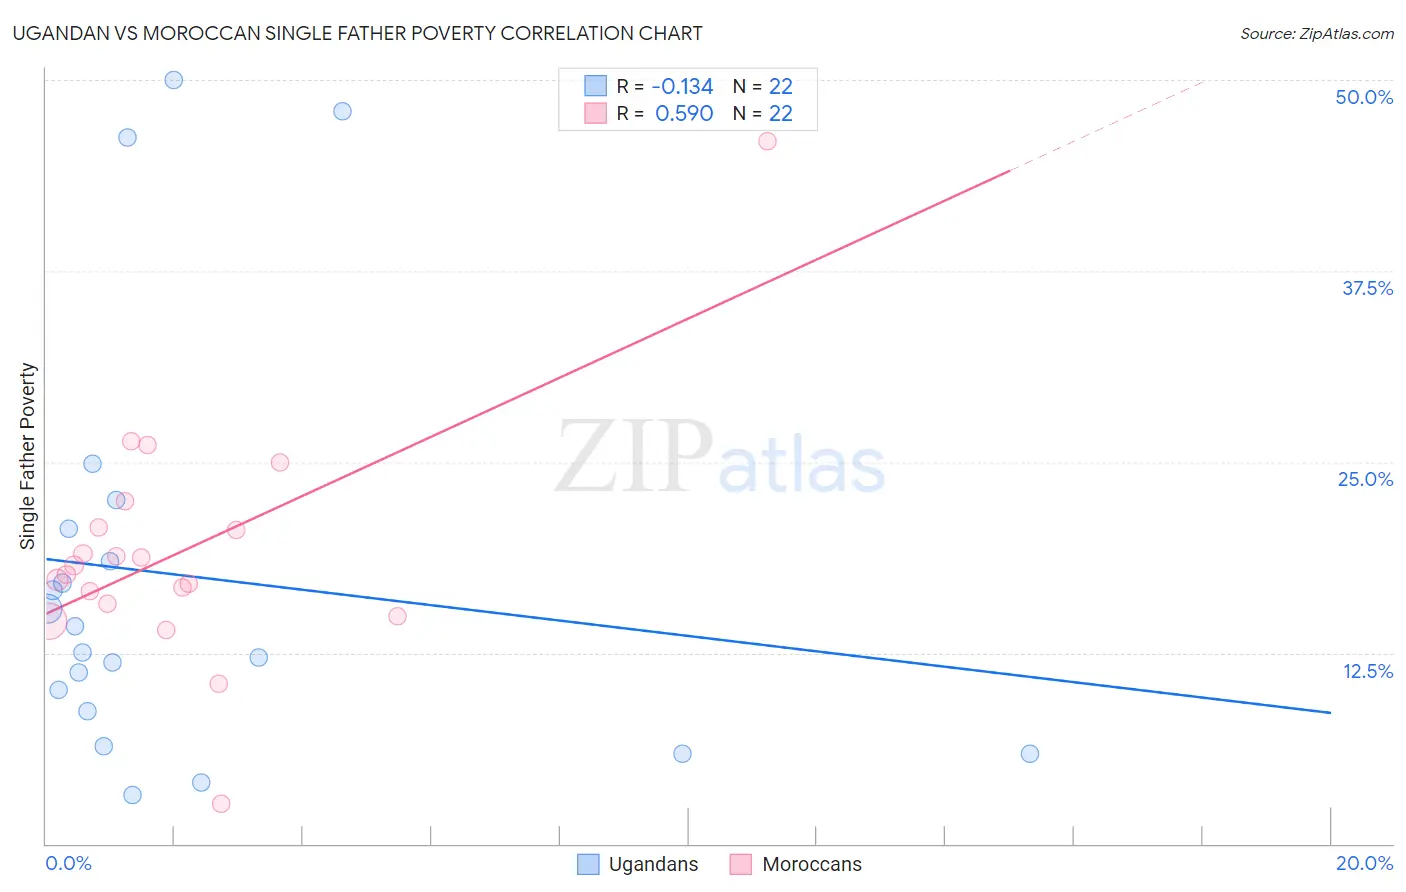
Ugandan vs Moroccan Single Father Poverty Correlation Chart
The statistical analysis conducted on geographies consisting of 87,224,974 people shows a poor negative correlation between the proportion of Ugandans and poverty level among single fathers in the United States with a correlation coefficient (R) of -0.134 and weighted average of 16.3%. Similarly, the statistical analysis conducted on geographies consisting of 173,540,722 people shows a substantial positive correlation between the proportion of Moroccans and poverty level among single fathers in the United States with a correlation coefficient (R) of 0.590 and weighted average of 17.0%, a difference of 4.5%.
Single Father Poverty Correlation Summary
| Measurement | Ugandan | Moroccan |
| Minimum | 3.2% | 2.6% |
| Maximum | 50.0% | 46.0% |
| Range | 46.8% | 43.4% |
| Mean | 17.5% | 19.1% |
| Median | 13.4% | 17.9% |
| Interquartile 25% (IQ1) | 8.7% | 15.7% |
| Interquartile 75% (IQ3) | 20.6% | 20.7% |
| Interquartile Range (IQR) | 11.9% | 5.0% |
| Standard Deviation (Sample) | 13.7% | 7.9% |
| Standard Deviation (Population) | 13.4% | 7.7% |
Similar Demographics by Single Father Poverty
Demographics Similar to Ugandans by Single Father Poverty
In terms of single father poverty, the demographic groups most similar to Ugandans are Immigrants from Costa Rica (16.3%, a difference of 0.010%), Guyanese (16.3%, a difference of 0.030%), Estonian (16.2%, a difference of 0.040%), Immigrants from Bangladesh (16.3%, a difference of 0.040%), and Immigrants from Europe (16.3%, a difference of 0.050%).
| Demographics | Rating | Rank | Single Father Poverty |
| Immigrants | Nicaragua | 67.8 /100 | #155 | Good 16.2% |
| Immigrants | Jordan | 66.0 /100 | #156 | Good 16.2% |
| Immigrants | Czechoslovakia | 62.8 /100 | #157 | Good 16.2% |
| Portuguese | 62.3 /100 | #158 | Good 16.2% |
| Belizeans | 59.9 /100 | #159 | Average 16.2% |
| Immigrants | Sudan | 59.8 /100 | #160 | Average 16.2% |
| Estonians | 56.7 /100 | #161 | Average 16.2% |
| Ugandans | 55.9 /100 | #162 | Average 16.3% |
| Immigrants | Costa Rica | 55.7 /100 | #163 | Average 16.3% |
| Guyanese | 55.2 /100 | #164 | Average 16.3% |
| Immigrants | Bangladesh | 55.1 /100 | #165 | Average 16.3% |
| Immigrants | Europe | 54.8 /100 | #166 | Average 16.3% |
| Yugoslavians | 53.9 /100 | #167 | Average 16.3% |
| Costa Ricans | 53.6 /100 | #168 | Average 16.3% |
| Northern Europeans | 52.8 /100 | #169 | Average 16.3% |
Demographics Similar to Moroccans by Single Father Poverty
In terms of single father poverty, the demographic groups most similar to Moroccans are Czech (17.0%, a difference of 0.10%), Finnish (16.9%, a difference of 0.22%), Bermudan (16.9%, a difference of 0.23%), Immigrants from Saudi Arabia (16.9%, a difference of 0.25%), and Subsaharan African (16.9%, a difference of 0.32%).
| Demographics | Rating | Rank | Single Father Poverty |
| Immigrants | Western Europe | 2.9 /100 | #235 | Tragic 16.9% |
| Immigrants | Germany | 2.9 /100 | #236 | Tragic 16.9% |
| Sub-Saharan Africans | 2.9 /100 | #237 | Tragic 16.9% |
| Immigrants | Saudi Arabia | 2.7 /100 | #238 | Tragic 16.9% |
| Bermudans | 2.6 /100 | #239 | Tragic 16.9% |
| Finns | 2.6 /100 | #240 | Tragic 16.9% |
| Czechs | 2.3 /100 | #241 | Tragic 17.0% |
| Moroccans | 2.1 /100 | #242 | Tragic 17.0% |
| Immigrants | Cabo Verde | 1.6 /100 | #243 | Tragic 17.0% |
| Hondurans | 1.6 /100 | #244 | Tragic 17.0% |
| Trinidadians and Tobagonians | 1.5 /100 | #245 | Tragic 17.0% |
| Immigrants | Ireland | 1.4 /100 | #246 | Tragic 17.1% |
| Greeks | 1.3 /100 | #247 | Tragic 17.1% |
| Czechoslovakians | 1.3 /100 | #248 | Tragic 17.1% |
| Canadians | 1.3 /100 | #249 | Tragic 17.1% |