Lumbee vs Immigrants from France Family Poverty
COMPARE
Lumbee
Immigrants from France
Family Poverty
Family Poverty Comparison
Lumbee
Immigrants from France
17.0%
FAMILY POVERTY
0.0/ 100
METRIC RATING
341st/ 347
METRIC RANK
8.2%
FAMILY POVERTY
94.4/ 100
METRIC RATING
112th/ 347
METRIC RANK
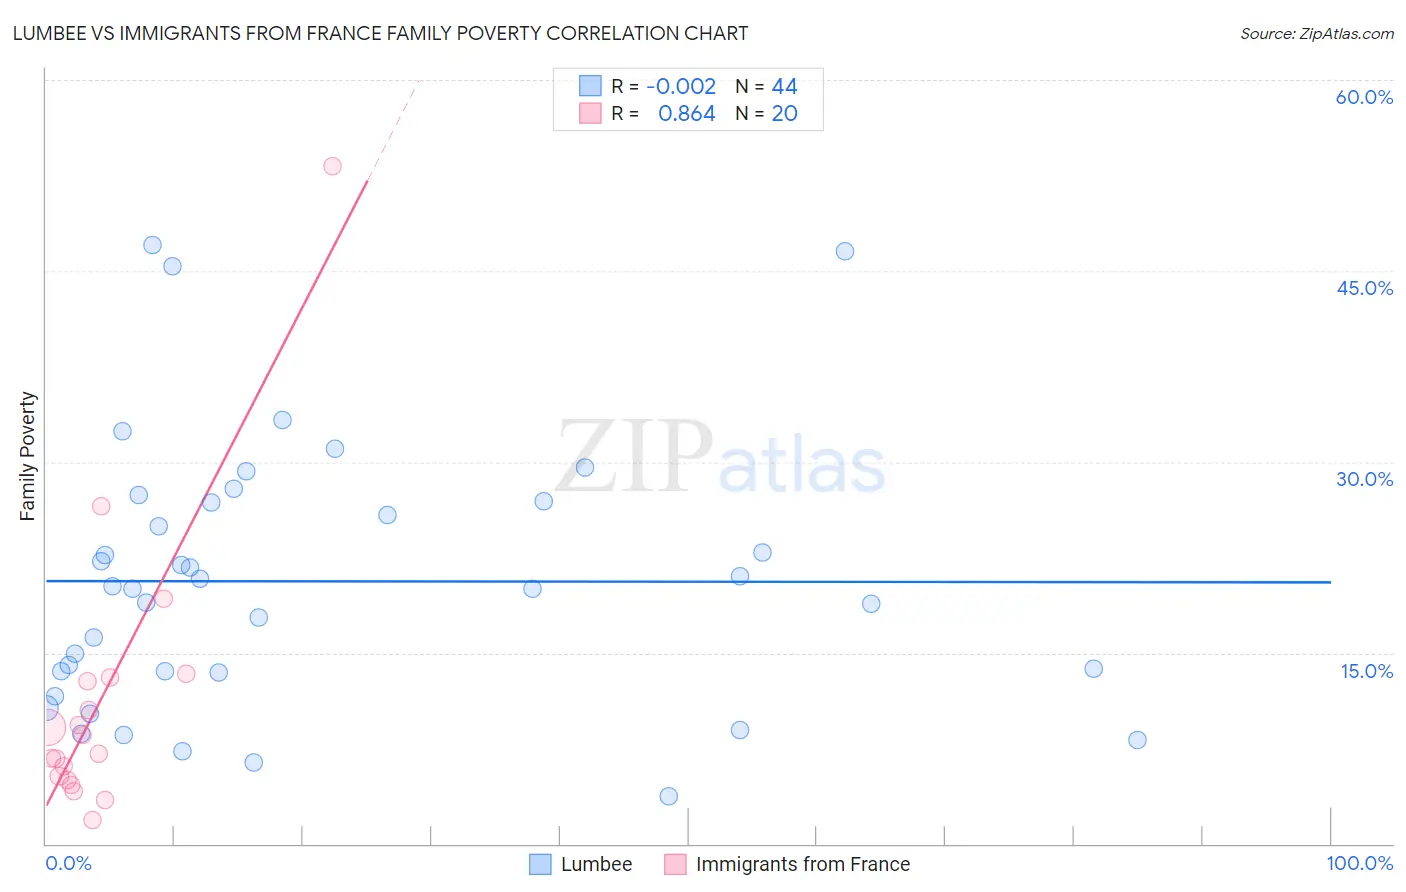
Lumbee vs Immigrants from France Family Poverty Correlation Chart
The statistical analysis conducted on geographies consisting of 92,238,507 people shows no correlation between the proportion of Lumbee and poverty level among families in the United States with a correlation coefficient (R) of -0.002 and weighted average of 17.0%. Similarly, the statistical analysis conducted on geographies consisting of 287,357,528 people shows a very strong positive correlation between the proportion of Immigrants from France and poverty level among families in the United States with a correlation coefficient (R) of 0.864 and weighted average of 8.2%, a difference of 108.0%.
Family Poverty Correlation Summary
| Measurement | Lumbee | Immigrants from France |
| Minimum | 3.7% | 1.9% |
| Maximum | 47.0% | 53.2% |
| Range | 43.3% | 51.3% |
| Mean | 20.6% | 11.3% |
| Median | 20.2% | 7.8% |
| Interquartile 25% (IQ1) | 13.5% | 5.2% |
| Interquartile 75% (IQ3) | 26.9% | 12.9% |
| Interquartile Range (IQR) | 13.4% | 7.7% |
| Standard Deviation (Sample) | 10.4% | 11.4% |
| Standard Deviation (Population) | 10.3% | 11.1% |
Similar Demographics by Family Poverty
Demographics Similar to Lumbee by Family Poverty
In terms of family poverty, the demographic groups most similar to Lumbee are Pueblo (17.0%, a difference of 0.070%), Yuman (16.6%, a difference of 2.1%), Immigrants from Yemen (17.5%, a difference of 2.8%), Crow (16.1%, a difference of 5.5%), and Hopi (15.9%, a difference of 6.7%).
| Demographics | Rating | Rank | Family Poverty |
| Immigrants | Dominican Republic | 0.0 /100 | #333 | Tragic 14.4% |
| Houma | 0.0 /100 | #334 | Tragic 14.6% |
| Apache | 0.0 /100 | #335 | Tragic 14.7% |
| Sioux | 0.0 /100 | #336 | Tragic 15.9% |
| Hopi | 0.0 /100 | #337 | Tragic 15.9% |
| Crow | 0.0 /100 | #338 | Tragic 16.1% |
| Yuman | 0.0 /100 | #339 | Tragic 16.6% |
| Pueblo | 0.0 /100 | #340 | Tragic 17.0% |
| Lumbee | 0.0 /100 | #341 | Tragic 17.0% |
| Immigrants | Yemen | 0.0 /100 | #342 | Tragic 17.5% |
| Pima | 0.0 /100 | #343 | Tragic 18.4% |
| Yup'ik | 0.0 /100 | #344 | Tragic 18.7% |
| Navajo | 0.0 /100 | #345 | Tragic 18.8% |
| Puerto Ricans | 0.0 /100 | #346 | Tragic 20.3% |
| Tohono O'odham | 0.0 /100 | #347 | Tragic 20.4% |
Demographics Similar to Immigrants from France by Family Poverty
In terms of family poverty, the demographic groups most similar to Immigrants from France are Taiwanese (8.2%, a difference of 0.11%), Romanian (8.2%, a difference of 0.16%), Canadian (8.2%, a difference of 0.17%), Jordanian (8.2%, a difference of 0.25%), and Immigrants from Zimbabwe (8.2%, a difference of 0.26%).
| Demographics | Rating | Rank | Family Poverty |
| Laotians | 95.6 /100 | #105 | Exceptional 8.1% |
| Egyptians | 95.1 /100 | #106 | Exceptional 8.1% |
| French Canadians | 95.0 /100 | #107 | Exceptional 8.1% |
| Basques | 94.9 /100 | #108 | Exceptional 8.1% |
| Jordanians | 94.8 /100 | #109 | Exceptional 8.2% |
| Romanians | 94.7 /100 | #110 | Exceptional 8.2% |
| Taiwanese | 94.6 /100 | #111 | Exceptional 8.2% |
| Immigrants | France | 94.4 /100 | #112 | Exceptional 8.2% |
| Canadians | 94.2 /100 | #113 | Exceptional 8.2% |
| Immigrants | Zimbabwe | 94.0 /100 | #114 | Exceptional 8.2% |
| Immigrants | Israel | 93.5 /100 | #115 | Exceptional 8.2% |
| South Africans | 93.4 /100 | #116 | Exceptional 8.2% |
| Immigrants | Russia | 93.2 /100 | #117 | Exceptional 8.2% |
| Immigrants | Western Europe | 92.9 /100 | #118 | Exceptional 8.2% |
| French | 92.8 /100 | #119 | Exceptional 8.3% |