Lumbee vs Immigrants from France Unemployment Among Ages 35 to 44 years
COMPARE
Lumbee
Immigrants from France
Unemployment Among Ages 35 to 44 years
Unemployment Among Ages 35 to 44 years Comparison
Lumbee
Immigrants from France
5.4%
UNEMPLOYMENT AMONG AGES 35 TO 44 YEARS
0.0/ 100
METRIC RATING
278th/ 347
METRIC RANK
4.5%
UNEMPLOYMENT AMONG AGES 35 TO 44 YEARS
92.5/ 100
METRIC RATING
97th/ 347
METRIC RANK
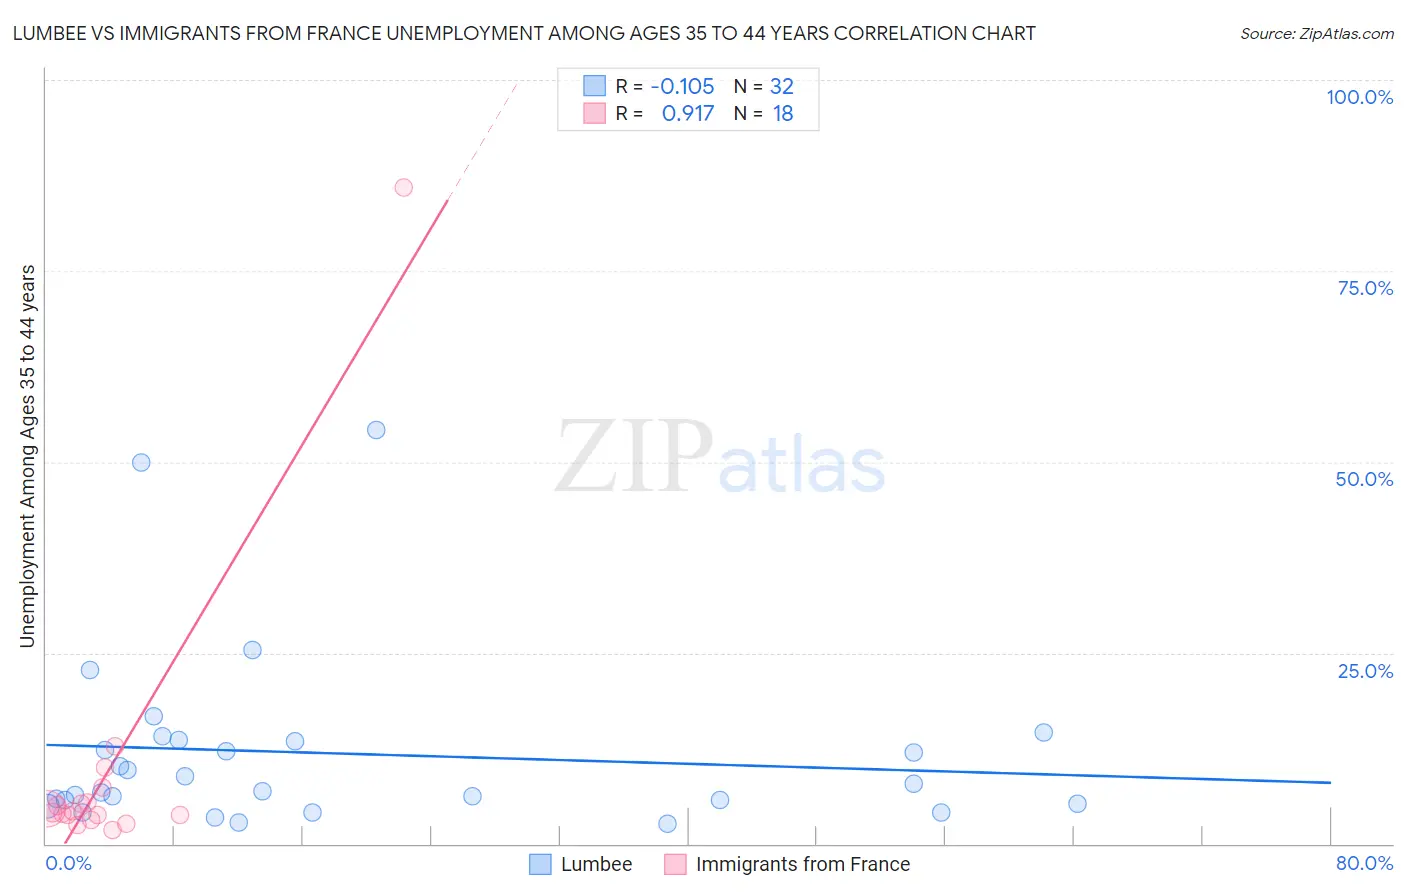
Lumbee vs Immigrants from France Unemployment Among Ages 35 to 44 years Correlation Chart
The statistical analysis conducted on geographies consisting of 91,399,128 people shows a poor negative correlation between the proportion of Lumbee and unemployment rate among population between the ages 35 and 44 in the United States with a correlation coefficient (R) of -0.105 and weighted average of 5.4%. Similarly, the statistical analysis conducted on geographies consisting of 283,330,530 people shows a near-perfect positive correlation between the proportion of Immigrants from France and unemployment rate among population between the ages 35 and 44 in the United States with a correlation coefficient (R) of 0.917 and weighted average of 4.5%, a difference of 20.1%.
Unemployment Among Ages 35 to 44 years Correlation Summary
| Measurement | Lumbee | Immigrants from France |
| Minimum | 2.6% | 1.8% |
| Maximum | 54.2% | 86.0% |
| Range | 51.6% | 84.2% |
| Mean | 11.8% | 9.4% |
| Median | 7.3% | 4.2% |
| Interquartile 25% (IQ1) | 5.4% | 3.8% |
| Interquartile 75% (IQ3) | 13.5% | 5.4% |
| Interquartile Range (IQR) | 8.1% | 1.7% |
| Standard Deviation (Sample) | 11.9% | 19.3% |
| Standard Deviation (Population) | 11.7% | 18.8% |
Similar Demographics by Unemployment Among Ages 35 to 44 years
Demographics Similar to Lumbee by Unemployment Among Ages 35 to 44 years
In terms of unemployment among ages 35 to 44 years, the demographic groups most similar to Lumbee are Immigrants from Senegal (5.4%, a difference of 0.060%), Ecuadorian (5.4%, a difference of 0.22%), Immigrants from Caribbean (5.4%, a difference of 0.23%), Immigrants from Portugal (5.4%, a difference of 0.27%), and Immigrants from Mexico (5.4%, a difference of 0.31%).
| Demographics | Rating | Rank | Unemployment Among Ages 35 to 44 years |
| Ute | 0.0 /100 | #271 | Tragic 5.3% |
| Senegalese | 0.0 /100 | #272 | Tragic 5.3% |
| Vietnamese | 0.0 /100 | #273 | Tragic 5.4% |
| Creek | 0.0 /100 | #274 | Tragic 5.4% |
| Immigrants | Mexico | 0.0 /100 | #275 | Tragic 5.4% |
| Native Hawaiians | 0.0 /100 | #276 | Tragic 5.4% |
| Immigrants | Caribbean | 0.0 /100 | #277 | Tragic 5.4% |
| Lumbee | 0.0 /100 | #278 | Tragic 5.4% |
| Immigrants | Senegal | 0.0 /100 | #279 | Tragic 5.4% |
| Ecuadorians | 0.0 /100 | #280 | Tragic 5.4% |
| Immigrants | Portugal | 0.0 /100 | #281 | Tragic 5.4% |
| Immigrants | Ghana | 0.0 /100 | #282 | Tragic 5.4% |
| Immigrants | Ecuador | 0.0 /100 | #283 | Tragic 5.4% |
| Haitians | 0.0 /100 | #284 | Tragic 5.5% |
| Hispanics or Latinos | 0.0 /100 | #285 | Tragic 5.5% |
Demographics Similar to Immigrants from France by Unemployment Among Ages 35 to 44 years
In terms of unemployment among ages 35 to 44 years, the demographic groups most similar to Immigrants from France are Immigrants from Canada (4.5%, a difference of 0.050%), Immigrants from Egypt (4.5%, a difference of 0.060%), Italian (4.5%, a difference of 0.15%), Immigrants from Netherlands (4.5%, a difference of 0.16%), and Immigrants from Sudan (4.5%, a difference of 0.19%).
| Demographics | Rating | Rank | Unemployment Among Ages 35 to 44 years |
| Australians | 94.5 /100 | #90 | Exceptional 4.5% |
| Immigrants | Northern Europe | 94.3 /100 | #91 | Exceptional 4.5% |
| Estonians | 94.3 /100 | #92 | Exceptional 4.5% |
| Iranians | 93.9 /100 | #93 | Exceptional 4.5% |
| Russians | 93.8 /100 | #94 | Exceptional 4.5% |
| Yugoslavians | 93.6 /100 | #95 | Exceptional 4.5% |
| Scottish | 93.5 /100 | #96 | Exceptional 4.5% |
| Immigrants | France | 92.5 /100 | #97 | Exceptional 4.5% |
| Immigrants | Canada | 92.3 /100 | #98 | Exceptional 4.5% |
| Immigrants | Egypt | 92.3 /100 | #99 | Exceptional 4.5% |
| Italians | 91.9 /100 | #100 | Exceptional 4.5% |
| Immigrants | Netherlands | 91.9 /100 | #101 | Exceptional 4.5% |
| Immigrants | Sudan | 91.8 /100 | #102 | Exceptional 4.5% |
| Welsh | 91.6 /100 | #103 | Exceptional 4.5% |
| Finns | 91.6 /100 | #104 | Exceptional 4.5% |