Lithuanian vs Icelander Single Mother Poverty
COMPARE
Lithuanian
Icelander
Single Mother Poverty
Single Mother Poverty Comparison
Lithuanians
Icelanders
27.4%
SINGLE MOTHER POVERTY
99.4/ 100
METRIC RATING
69th/ 347
METRIC RANK
29.5%
SINGLE MOTHER POVERTY
26.1/ 100
METRIC RATING
194th/ 347
METRIC RANK
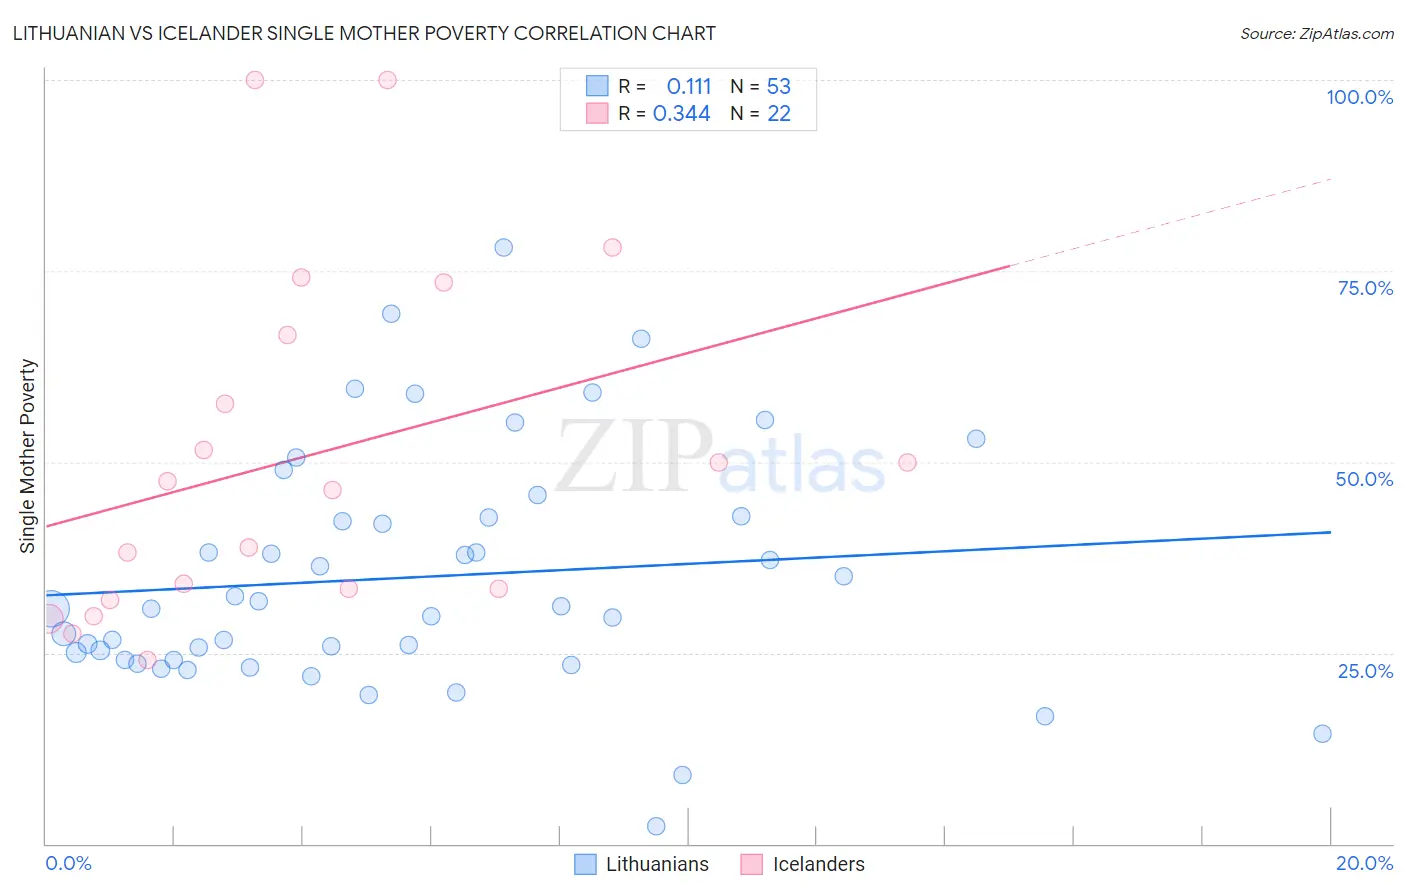
Lithuanian vs Icelander Single Mother Poverty Correlation Chart
The statistical analysis conducted on geographies consisting of 407,174,767 people shows a poor positive correlation between the proportion of Lithuanians and poverty level among single mothers in the United States with a correlation coefficient (R) of 0.111 and weighted average of 27.4%. Similarly, the statistical analysis conducted on geographies consisting of 157,541,797 people shows a mild positive correlation between the proportion of Icelanders and poverty level among single mothers in the United States with a correlation coefficient (R) of 0.344 and weighted average of 29.5%, a difference of 7.8%.
Single Mother Poverty Correlation Summary
| Measurement | Lithuanian | Icelander |
| Minimum | 2.2% | 24.1% |
| Maximum | 78.1% | 100.0% |
| Range | 75.9% | 75.9% |
| Mean | 34.9% | 50.7% |
| Median | 30.8% | 46.9% |
| Interquartile 25% (IQ1) | 24.1% | 33.3% |
| Interquartile 75% (IQ3) | 42.8% | 66.7% |
| Interquartile Range (IQR) | 18.7% | 33.3% |
| Standard Deviation (Sample) | 15.6% | 22.6% |
| Standard Deviation (Population) | 15.5% | 22.0% |
Similar Demographics by Single Mother Poverty
Demographics Similar to Lithuanians by Single Mother Poverty
In terms of single mother poverty, the demographic groups most similar to Lithuanians are Immigrants from Belarus (27.4%, a difference of 0.010%), Macedonian (27.4%, a difference of 0.030%), Immigrants from Russia (27.4%, a difference of 0.060%), Sierra Leonean (27.4%, a difference of 0.12%), and Immigrants from Czechoslovakia (27.4%, a difference of 0.16%).
| Demographics | Rating | Rank | Single Mother Poverty |
| Immigrants | Malaysia | 99.5 /100 | #62 | Exceptional 27.3% |
| Immigrants | Northern Europe | 99.5 /100 | #63 | Exceptional 27.3% |
| Russians | 99.5 /100 | #64 | Exceptional 27.3% |
| Immigrants | Turkey | 99.5 /100 | #65 | Exceptional 27.3% |
| Soviet Union | 99.5 /100 | #66 | Exceptional 27.3% |
| Immigrants | Australia | 99.5 /100 | #67 | Exceptional 27.3% |
| Immigrants | Czechoslovakia | 99.5 /100 | #68 | Exceptional 27.4% |
| Lithuanians | 99.4 /100 | #69 | Exceptional 27.4% |
| Immigrants | Belarus | 99.4 /100 | #70 | Exceptional 27.4% |
| Macedonians | 99.4 /100 | #71 | Exceptional 27.4% |
| Immigrants | Russia | 99.4 /100 | #72 | Exceptional 27.4% |
| Sierra Leoneans | 99.3 /100 | #73 | Exceptional 27.4% |
| Immigrants | Europe | 99.3 /100 | #74 | Exceptional 27.4% |
| Immigrants | Sweden | 99.2 /100 | #75 | Exceptional 27.5% |
| Peruvians | 99.2 /100 | #76 | Exceptional 27.5% |
Demographics Similar to Icelanders by Single Mother Poverty
In terms of single mother poverty, the demographic groups most similar to Icelanders are Slavic (29.6%, a difference of 0.10%), Basque (29.5%, a difference of 0.13%), Moroccan (29.5%, a difference of 0.15%), Spanish American Indian (29.6%, a difference of 0.17%), and Immigrants from Trinidad and Tobago (29.5%, a difference of 0.19%).
| Demographics | Rating | Rank | Single Mother Poverty |
| Lebanese | 32.5 /100 | #187 | Fair 29.4% |
| Guamanians/Chamorros | 31.8 /100 | #188 | Fair 29.4% |
| Immigrants | Africa | 31.6 /100 | #189 | Fair 29.4% |
| Immigrants | Germany | 30.4 /100 | #190 | Fair 29.5% |
| Immigrants | Trinidad and Tobago | 29.2 /100 | #191 | Fair 29.5% |
| Moroccans | 28.6 /100 | #192 | Fair 29.5% |
| Basques | 28.3 /100 | #193 | Fair 29.5% |
| Icelanders | 26.1 /100 | #194 | Fair 29.5% |
| Slavs | 24.5 /100 | #195 | Fair 29.6% |
| Spanish American Indians | 23.4 /100 | #196 | Fair 29.6% |
| Immigrants | Jamaica | 22.0 /100 | #197 | Fair 29.6% |
| Trinidadians and Tobagonians | 21.7 /100 | #198 | Fair 29.6% |
| Cubans | 20.8 /100 | #199 | Fair 29.6% |
| Panamanians | 20.0 /100 | #200 | Fair 29.6% |
| Belgians | 18.8 /100 | #201 | Poor 29.7% |