Liberian vs Romanian Male Poverty
COMPARE
Liberian
Romanian
Male Poverty
Male Poverty Comparison
Liberians
Romanians
12.8%
MALE POVERTY
0.3/ 100
METRIC RATING
245th/ 347
METRIC RANK
10.5%
MALE POVERTY
93.6/ 100
METRIC RATING
97th/ 347
METRIC RANK
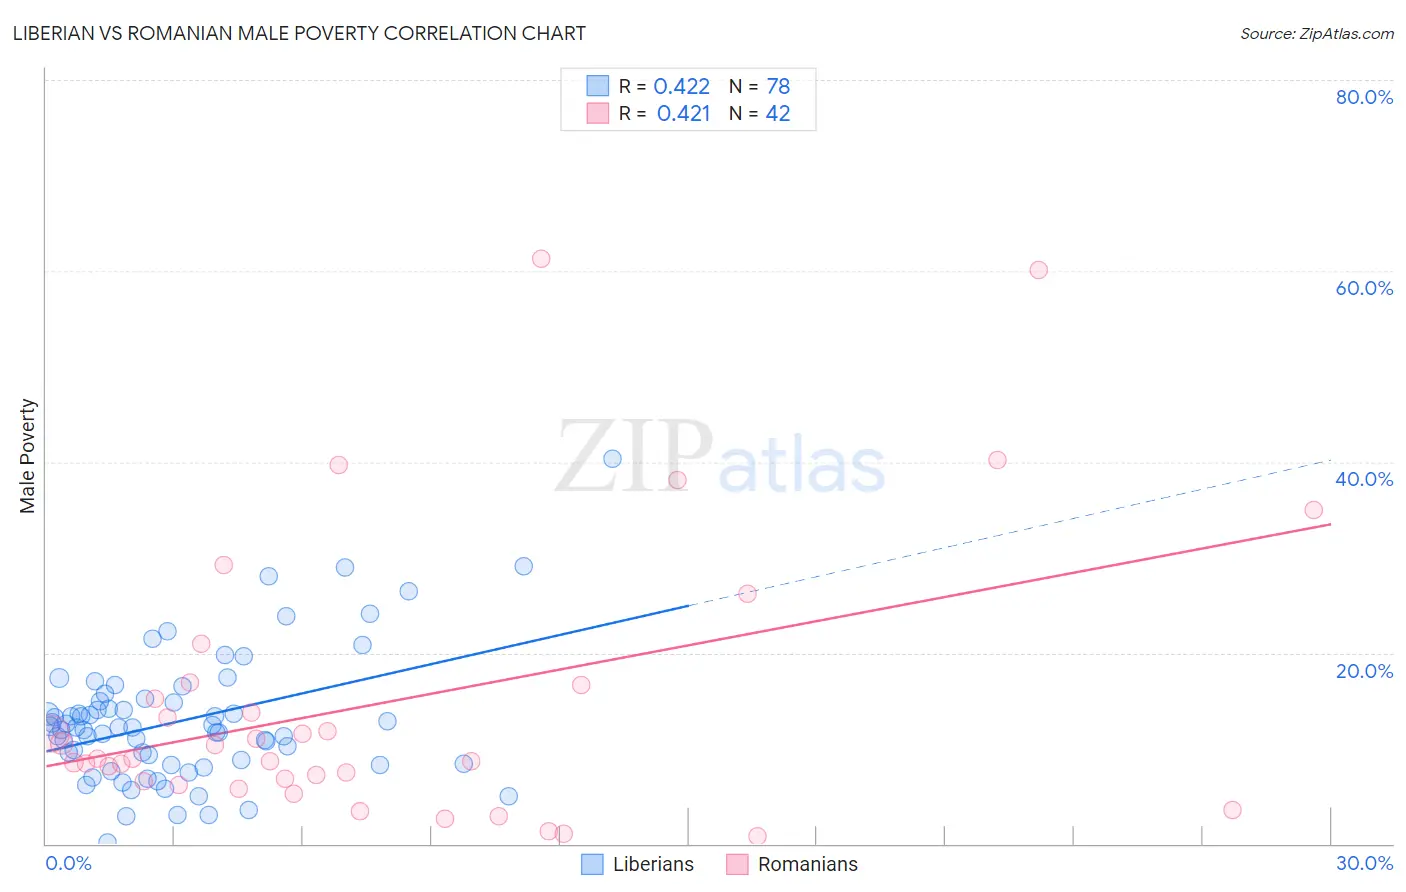
Liberian vs Romanian Male Poverty Correlation Chart
The statistical analysis conducted on geographies consisting of 118,033,924 people shows a moderate positive correlation between the proportion of Liberians and poverty level among males in the United States with a correlation coefficient (R) of 0.422 and weighted average of 12.8%. Similarly, the statistical analysis conducted on geographies consisting of 377,566,833 people shows a moderate positive correlation between the proportion of Romanians and poverty level among males in the United States with a correlation coefficient (R) of 0.421 and weighted average of 10.5%, a difference of 22.5%.
Male Poverty Correlation Summary
| Measurement | Liberian | Romanian |
| Minimum | 0.17% | 0.81% |
| Maximum | 40.3% | 61.3% |
| Range | 40.1% | 60.5% |
| Mean | 12.9% | 14.8% |
| Median | 12.1% | 8.9% |
| Interquartile 25% (IQ1) | 8.4% | 6.5% |
| Interquartile 75% (IQ3) | 15.0% | 16.6% |
| Interquartile Range (IQR) | 6.6% | 10.1% |
| Standard Deviation (Sample) | 6.8% | 14.7% |
| Standard Deviation (Population) | 6.8% | 14.5% |
Similar Demographics by Male Poverty
Demographics Similar to Liberians by Male Poverty
In terms of male poverty, the demographic groups most similar to Liberians are Tsimshian (12.8%, a difference of 0.010%), Alaskan Athabascan (12.8%, a difference of 0.12%), Nepalese (12.8%, a difference of 0.16%), Immigrants from El Salvador (12.8%, a difference of 0.30%), and Sudanese (12.8%, a difference of 0.32%).
| Demographics | Rating | Rank | Male Poverty |
| Ecuadorians | 0.4 /100 | #238 | Tragic 12.7% |
| Ghanaians | 0.4 /100 | #239 | Tragic 12.7% |
| Immigrants | Middle Africa | 0.4 /100 | #240 | Tragic 12.7% |
| Sudanese | 0.3 /100 | #241 | Tragic 12.8% |
| Nepalese | 0.3 /100 | #242 | Tragic 12.8% |
| Alaskan Athabascans | 0.3 /100 | #243 | Tragic 12.8% |
| Tsimshian | 0.3 /100 | #244 | Tragic 12.8% |
| Liberians | 0.3 /100 | #245 | Tragic 12.8% |
| Immigrants | El Salvador | 0.2 /100 | #246 | Tragic 12.8% |
| Immigrants | Western Africa | 0.2 /100 | #247 | Tragic 12.9% |
| Immigrants | Sudan | 0.2 /100 | #248 | Tragic 12.9% |
| Potawatomi | 0.2 /100 | #249 | Tragic 12.9% |
| Immigrants | Nicaragua | 0.2 /100 | #250 | Tragic 12.9% |
| Immigrants | Cuba | 0.2 /100 | #251 | Tragic 12.9% |
| Immigrants | Ecuador | 0.2 /100 | #252 | Tragic 12.9% |
Demographics Similar to Romanians by Male Poverty
In terms of male poverty, the demographic groups most similar to Romanians are Immigrants from Egypt (10.4%, a difference of 0.050%), Finnish (10.5%, a difference of 0.060%), Immigrants from Indonesia (10.5%, a difference of 0.13%), Scottish (10.4%, a difference of 0.18%), and Immigrants from South Africa (10.4%, a difference of 0.22%).
| Demographics | Rating | Rank | Male Poverty |
| Indians (Asian) | 94.9 /100 | #90 | Exceptional 10.4% |
| British | 94.8 /100 | #91 | Exceptional 10.4% |
| Jordanians | 94.4 /100 | #92 | Exceptional 10.4% |
| Australians | 94.4 /100 | #93 | Exceptional 10.4% |
| Immigrants | South Africa | 94.1 /100 | #94 | Exceptional 10.4% |
| Scottish | 94.0 /100 | #95 | Exceptional 10.4% |
| Immigrants | Egypt | 93.7 /100 | #96 | Exceptional 10.4% |
| Romanians | 93.6 /100 | #97 | Exceptional 10.5% |
| Finns | 93.4 /100 | #98 | Exceptional 10.5% |
| Immigrants | Indonesia | 93.3 /100 | #99 | Exceptional 10.5% |
| Immigrants | Latvia | 92.8 /100 | #100 | Exceptional 10.5% |
| Immigrants | Zimbabwe | 92.0 /100 | #101 | Exceptional 10.5% |
| French Canadians | 91.9 /100 | #102 | Exceptional 10.5% |
| Slavs | 91.7 /100 | #103 | Exceptional 10.5% |
| Welsh | 91.6 /100 | #104 | Exceptional 10.5% |