Liberian vs Hungarian Unemployment Among Seniors over 75 years
COMPARE
Liberian
Hungarian
Unemployment Among Seniors over 75 years
Unemployment Among Seniors over 75 years Comparison
Liberians
Hungarians
10.2%
UNEMPLOYMENT AMONG SENIORS OVER 75 YEARS
0.0/ 100
METRIC RATING
318th/ 347
METRIC RANK
10.1%
UNEMPLOYMENT AMONG SENIORS OVER 75 YEARS
0.0/ 100
METRIC RATING
310th/ 347
METRIC RANK
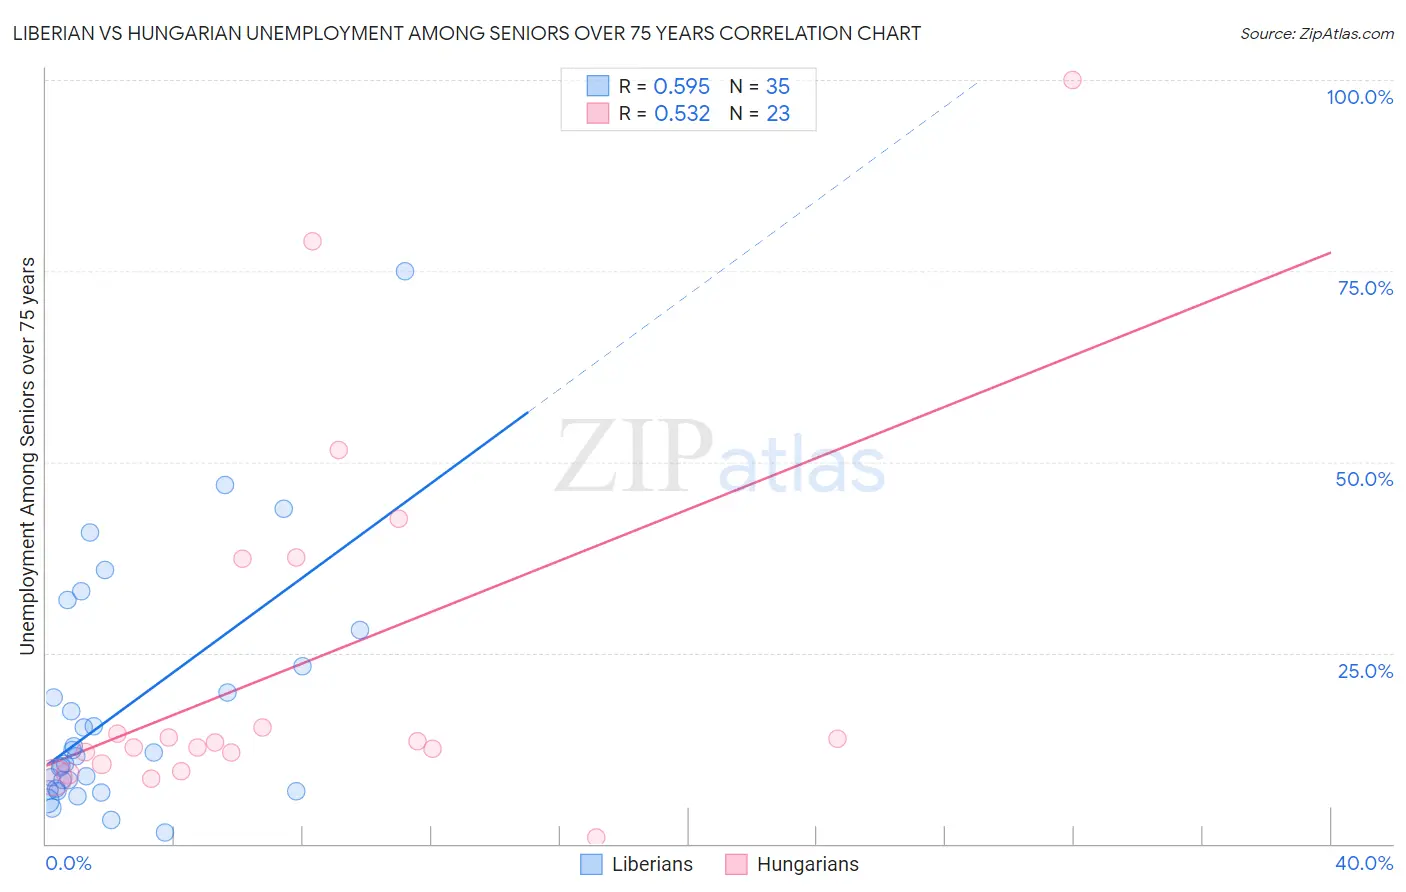
Liberian vs Hungarian Unemployment Among Seniors over 75 years Correlation Chart
The statistical analysis conducted on geographies consisting of 84,949,227 people shows a substantial positive correlation between the proportion of Liberians and unemployment rate among seniors over the age of 75 in the United States with a correlation coefficient (R) of 0.595 and weighted average of 10.2%. Similarly, the statistical analysis conducted on geographies consisting of 221,758,984 people shows a substantial positive correlation between the proportion of Hungarians and unemployment rate among seniors over the age of 75 in the United States with a correlation coefficient (R) of 0.532 and weighted average of 10.1%, a difference of 1.5%.
Unemployment Among Seniors over 75 years Correlation Summary
| Measurement | Liberian | Hungarian |
| Minimum | 1.4% | 0.90% |
| Maximum | 75.0% | 100.0% |
| Range | 73.6% | 99.1% |
| Mean | 17.6% | 23.5% |
| Median | 11.5% | 13.2% |
| Interquartile 25% (IQ1) | 7.0% | 10.4% |
| Interquartile 75% (IQ3) | 23.2% | 37.3% |
| Interquartile Range (IQR) | 16.2% | 26.9% |
| Standard Deviation (Sample) | 15.7% | 24.5% |
| Standard Deviation (Population) | 15.5% | 23.9% |
Demographics Similar to Liberians and Hungarians by Unemployment Among Seniors over 75 years
In terms of unemployment among seniors over 75 years, the demographic groups most similar to Liberians are German (10.3%, a difference of 0.070%), Irish (10.2%, a difference of 0.12%), French (10.3%, a difference of 0.29%), Aleut (10.3%, a difference of 0.31%), and Native/Alaskan (10.2%, a difference of 0.49%). Similarly, the demographic groups most similar to Hungarians are Scottish (10.1%, a difference of 0.11%), Chippewa (10.1%, a difference of 0.13%), English (10.1%, a difference of 0.19%), White/Caucasian (10.1%, a difference of 0.25%), and Nepalese (10.1%, a difference of 0.25%).
| Demographics | Rating | Rank | Unemployment Among Seniors over 75 years |
| Scotch-Irish | 0.0 /100 | #304 | Tragic 10.0% |
| Swedes | 0.0 /100 | #305 | Tragic 10.0% |
| Italians | 0.0 /100 | #306 | Tragic 10.0% |
| Immigrants | Fiji | 0.0 /100 | #307 | Tragic 10.0% |
| Whites/Caucasians | 0.0 /100 | #308 | Tragic 10.1% |
| English | 0.0 /100 | #309 | Tragic 10.1% |
| Hungarians | 0.0 /100 | #310 | Tragic 10.1% |
| Scottish | 0.0 /100 | #311 | Tragic 10.1% |
| Chippewa | 0.0 /100 | #312 | Tragic 10.1% |
| Nepalese | 0.0 /100 | #313 | Tragic 10.1% |
| Dutch West Indians | 0.0 /100 | #314 | Tragic 10.2% |
| Pennsylvania Germans | 0.0 /100 | #315 | Tragic 10.2% |
| Natives/Alaskans | 0.0 /100 | #316 | Tragic 10.2% |
| Irish | 0.0 /100 | #317 | Tragic 10.2% |
| Liberians | 0.0 /100 | #318 | Tragic 10.2% |
| Germans | 0.0 /100 | #319 | Tragic 10.3% |
| French | 0.0 /100 | #320 | Tragic 10.3% |
| Aleuts | 0.0 /100 | #321 | Tragic 10.3% |
| Poles | 0.0 /100 | #322 | Tragic 10.3% |
| Tongans | 0.0 /100 | #323 | Tragic 10.4% |
| Americans | 0.0 /100 | #324 | Tragic 10.4% |