Filipino vs Immigrants from Hong Kong Single Mother Poverty
COMPARE
Filipino
Immigrants from Hong Kong
Single Mother Poverty
Single Mother Poverty Comparison
Filipinos
Immigrants from Hong Kong
24.3%
SINGLE MOTHER POVERTY
100.0/ 100
METRIC RATING
4th/ 347
METRIC RANK
24.4%
SINGLE MOTHER POVERTY
100.0/ 100
METRIC RATING
5th/ 347
METRIC RANK
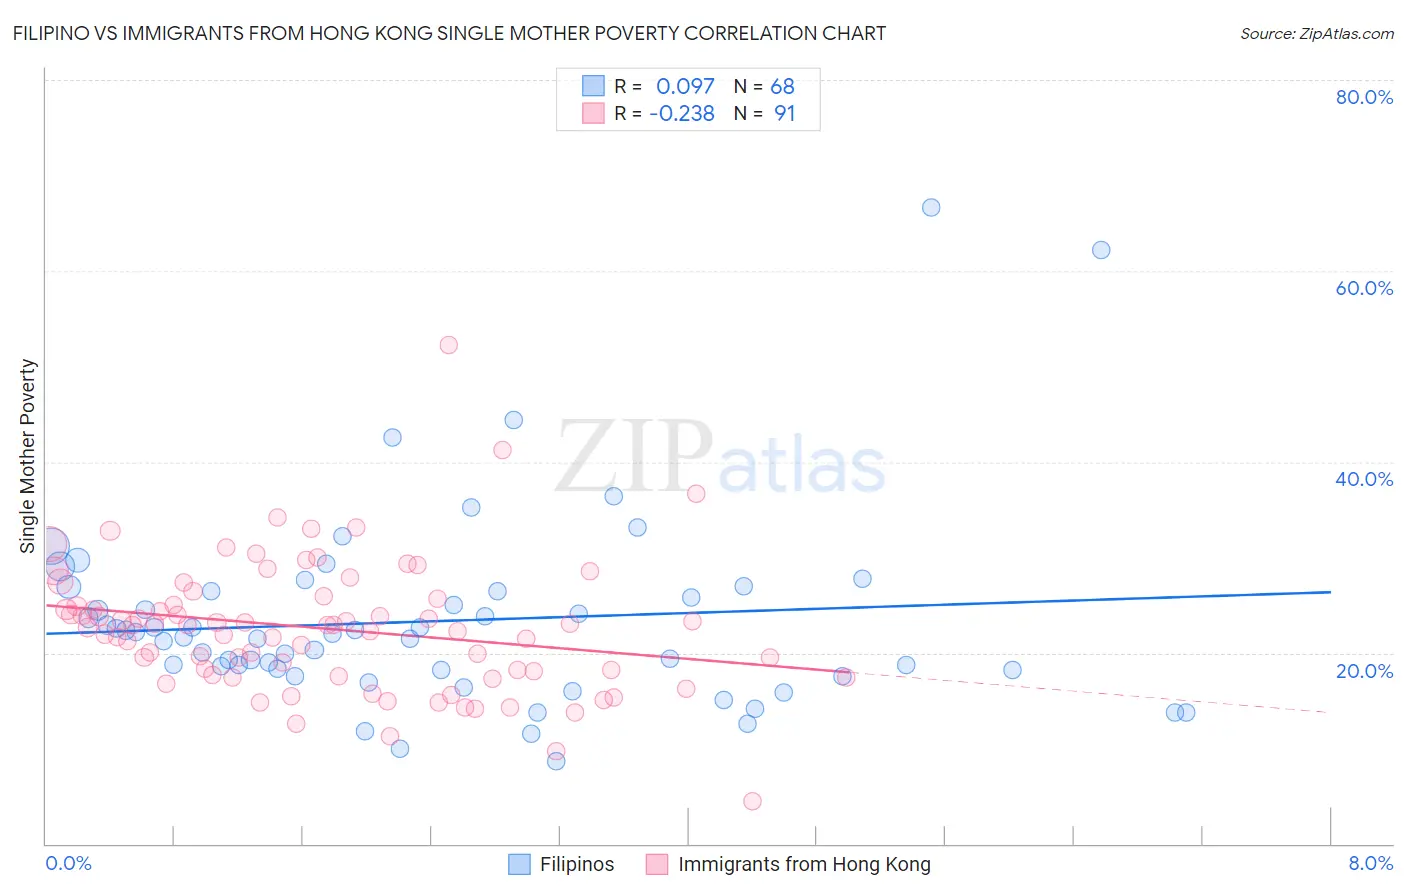
Filipino vs Immigrants from Hong Kong Single Mother Poverty Correlation Chart
The statistical analysis conducted on geographies consisting of 249,212,409 people shows a slight positive correlation between the proportion of Filipinos and poverty level among single mothers in the United States with a correlation coefficient (R) of 0.097 and weighted average of 24.3%. Similarly, the statistical analysis conducted on geographies consisting of 248,457,353 people shows a weak negative correlation between the proportion of Immigrants from Hong Kong and poverty level among single mothers in the United States with a correlation coefficient (R) of -0.238 and weighted average of 24.4%, a difference of 0.23%.
Single Mother Poverty Correlation Summary
| Measurement | Filipino | Immigrants from Hong Kong |
| Minimum | 8.6% | 4.5% |
| Maximum | 66.7% | 52.3% |
| Range | 58.1% | 47.8% |
| Mean | 23.3% | 22.5% |
| Median | 21.8% | 22.9% |
| Interquartile 25% (IQ1) | 18.2% | 17.7% |
| Interquartile 75% (IQ3) | 26.5% | 25.6% |
| Interquartile Range (IQR) | 8.3% | 7.9% |
| Standard Deviation (Sample) | 10.0% | 7.0% |
| Standard Deviation (Population) | 9.9% | 6.9% |
Demographics Similar to Filipinos and Immigrants from Hong Kong by Single Mother Poverty
In terms of single mother poverty, the demographic groups most similar to Filipinos are Thai (24.5%, a difference of 0.72%), Chinese (24.6%, a difference of 1.3%), Immigrants from Taiwan (23.9%, a difference of 1.9%), Immigrants from India (23.8%, a difference of 2.1%), and Assyrian/Chaldean/Syriac (23.8%, a difference of 2.1%). Similarly, the demographic groups most similar to Immigrants from Hong Kong are Thai (24.5%, a difference of 0.49%), Chinese (24.6%, a difference of 1.0%), Immigrants from Taiwan (23.9%, a difference of 2.1%), Immigrants from India (23.8%, a difference of 2.4%), and Assyrian/Chaldean/Syriac (23.8%, a difference of 2.4%).
| Demographics | Rating | Rank | Single Mother Poverty |
| Assyrians/Chaldeans/Syriacs | 100.0 /100 | #1 | Exceptional 23.8% |
| Immigrants | India | 100.0 /100 | #2 | Exceptional 23.8% |
| Immigrants | Taiwan | 100.0 /100 | #3 | Exceptional 23.9% |
| Filipinos | 100.0 /100 | #4 | Exceptional 24.3% |
| Immigrants | Hong Kong | 100.0 /100 | #5 | Exceptional 24.4% |
| Thais | 100.0 /100 | #6 | Exceptional 24.5% |
| Chinese | 100.0 /100 | #7 | Exceptional 24.6% |
| Immigrants | Iran | 100.0 /100 | #8 | Exceptional 25.1% |
| Immigrants | Lithuania | 100.0 /100 | #9 | Exceptional 25.2% |
| Immigrants | South Central Asia | 100.0 /100 | #10 | Exceptional 25.3% |
| Iranians | 100.0 /100 | #11 | Exceptional 25.5% |
| Bhutanese | 100.0 /100 | #12 | Exceptional 25.6% |
| Indians (Asian) | 100.0 /100 | #13 | Exceptional 25.8% |
| Immigrants | Singapore | 100.0 /100 | #14 | Exceptional 25.8% |
| Immigrants | Ireland | 100.0 /100 | #15 | Exceptional 25.8% |
| Bolivians | 100.0 /100 | #16 | Exceptional 25.9% |
| Asians | 100.0 /100 | #17 | Exceptional 26.0% |
| Immigrants | Pakistan | 100.0 /100 | #18 | Exceptional 26.0% |
| Immigrants | Eastern Asia | 100.0 /100 | #19 | Exceptional 26.1% |
| Immigrants | China | 100.0 /100 | #20 | Exceptional 26.1% |