Latvian vs Hopi Seniors Poverty Over the Age of 65
COMPARE
Latvian
Hopi
Seniors Poverty Over the Age of 65
Seniors Poverty Over the Age of 65 Comparison
Latvians
Hopi
9.5%
SENIORS POVERTY OVER THE AGE OF 65
99.8/ 100
METRIC RATING
35th/ 347
METRIC RANK
17.8%
SENIORS POVERTY OVER THE AGE OF 65
0.0/ 100
METRIC RATING
340th/ 347
METRIC RANK
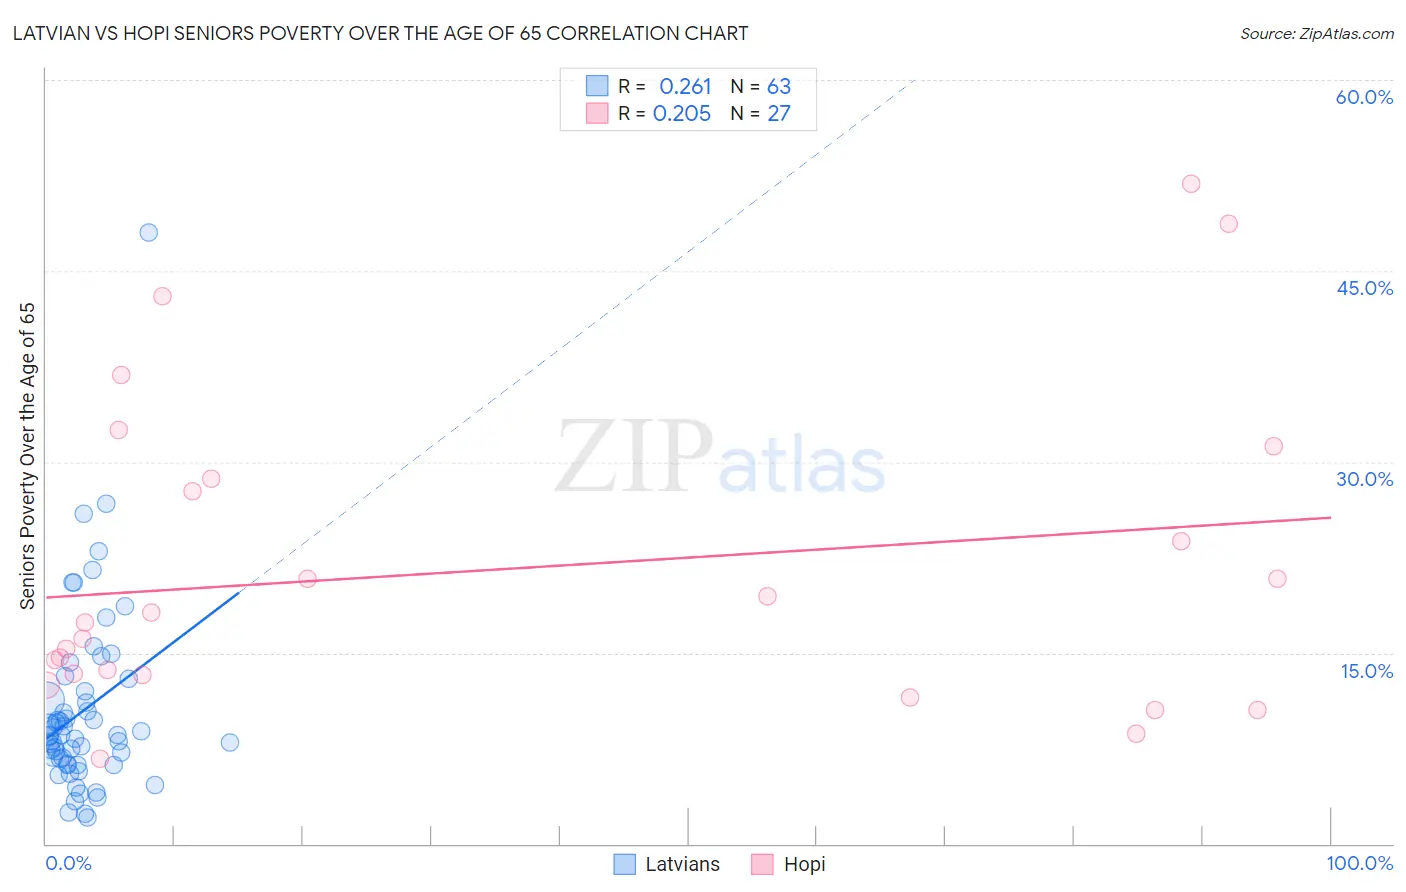
Latvian vs Hopi Seniors Poverty Over the Age of 65 Correlation Chart
The statistical analysis conducted on geographies consisting of 220,200,877 people shows a weak positive correlation between the proportion of Latvians and poverty level among seniors over the age of 65 in the United States with a correlation coefficient (R) of 0.261 and weighted average of 9.5%. Similarly, the statistical analysis conducted on geographies consisting of 74,556,917 people shows a weak positive correlation between the proportion of Hopi and poverty level among seniors over the age of 65 in the United States with a correlation coefficient (R) of 0.205 and weighted average of 17.8%, a difference of 88.1%.
Seniors Poverty Over the Age of 65 Correlation Summary
| Measurement | Latvian | Hopi |
| Minimum | 2.0% | 6.7% |
| Maximum | 48.0% | 51.9% |
| Range | 46.0% | 45.2% |
| Mean | 10.5% | 21.6% |
| Median | 8.5% | 17.4% |
| Interquartile 25% (IQ1) | 6.3% | 13.3% |
| Interquartile 75% (IQ3) | 12.0% | 28.7% |
| Interquartile Range (IQR) | 5.7% | 15.4% |
| Standard Deviation (Sample) | 7.4% | 12.2% |
| Standard Deviation (Population) | 7.3% | 12.0% |
Similar Demographics by Seniors Poverty Over the Age of 65
Demographics Similar to Latvians by Seniors Poverty Over the Age of 65
In terms of seniors poverty over the age of 65, the demographic groups most similar to Latvians are Czechoslovakian (9.5%, a difference of 0.050%), British (9.4%, a difference of 0.38%), Native Hawaiian (9.4%, a difference of 0.48%), Northern European (9.4%, a difference of 0.50%), and Scotch-Irish (9.5%, a difference of 0.55%).
| Demographics | Rating | Rank | Seniors Poverty Over the Age of 65 |
| Tongans | 99.9 /100 | #28 | Exceptional 9.3% |
| Bhutanese | 99.9 /100 | #29 | Exceptional 9.3% |
| Menominee | 99.8 /100 | #30 | Exceptional 9.4% |
| Finns | 99.8 /100 | #31 | Exceptional 9.4% |
| Northern Europeans | 99.8 /100 | #32 | Exceptional 9.4% |
| Native Hawaiians | 99.8 /100 | #33 | Exceptional 9.4% |
| British | 99.8 /100 | #34 | Exceptional 9.4% |
| Latvians | 99.8 /100 | #35 | Exceptional 9.5% |
| Czechoslovakians | 99.8 /100 | #36 | Exceptional 9.5% |
| Scotch-Irish | 99.7 /100 | #37 | Exceptional 9.5% |
| Belgians | 99.7 /100 | #38 | Exceptional 9.5% |
| Greeks | 99.6 /100 | #39 | Exceptional 9.6% |
| Assyrians/Chaldeans/Syriacs | 99.6 /100 | #40 | Exceptional 9.6% |
| Immigrants | North Macedonia | 99.6 /100 | #41 | Exceptional 9.6% |
| Zimbabweans | 99.6 /100 | #42 | Exceptional 9.6% |
Demographics Similar to Hopi by Seniors Poverty Over the Age of 65
In terms of seniors poverty over the age of 65, the demographic groups most similar to Hopi are Dominican (17.8%, a difference of 0.39%), Immigrants from Cuba (17.9%, a difference of 0.87%), Navajo (17.5%, a difference of 1.9%), Lumbee (18.1%, a difference of 2.0%), and Immigrants from Dominican Republic (18.3%, a difference of 2.9%).
| Demographics | Rating | Rank | Seniors Poverty Over the Age of 65 |
| Immigrants | Yemen | 0.0 /100 | #333 | Tragic 15.9% |
| Immigrants | Nicaragua | 0.0 /100 | #334 | Tragic 15.9% |
| Cubans | 0.0 /100 | #335 | Tragic 16.1% |
| Immigrants | Cabo Verde | 0.0 /100 | #336 | Tragic 16.2% |
| Immigrants | Caribbean | 0.0 /100 | #337 | Tragic 16.5% |
| Pueblo | 0.0 /100 | #338 | Tragic 17.2% |
| Navajo | 0.0 /100 | #339 | Tragic 17.5% |
| Hopi | 0.0 /100 | #340 | Tragic 17.8% |
| Dominicans | 0.0 /100 | #341 | Tragic 17.8% |
| Immigrants | Cuba | 0.0 /100 | #342 | Tragic 17.9% |
| Lumbee | 0.0 /100 | #343 | Tragic 18.1% |
| Immigrants | Dominican Republic | 0.0 /100 | #344 | Tragic 18.3% |
| Pima | 0.0 /100 | #345 | Tragic 19.8% |
| Tohono O'odham | 0.0 /100 | #346 | Tragic 20.8% |
| Puerto Ricans | 0.0 /100 | #347 | Tragic 21.4% |