Latvian vs Immigrants from Somalia Seniors Poverty Over the Age of 65
COMPARE
Latvian
Immigrants from Somalia
Seniors Poverty Over the Age of 65
Seniors Poverty Over the Age of 65 Comparison
Latvians
Immigrants from Somalia
9.5%
SENIORS POVERTY OVER THE AGE OF 65
99.8/ 100
METRIC RATING
35th/ 347
METRIC RANK
12.6%
SENIORS POVERTY OVER THE AGE OF 65
0.1/ 100
METRIC RATING
268th/ 347
METRIC RANK
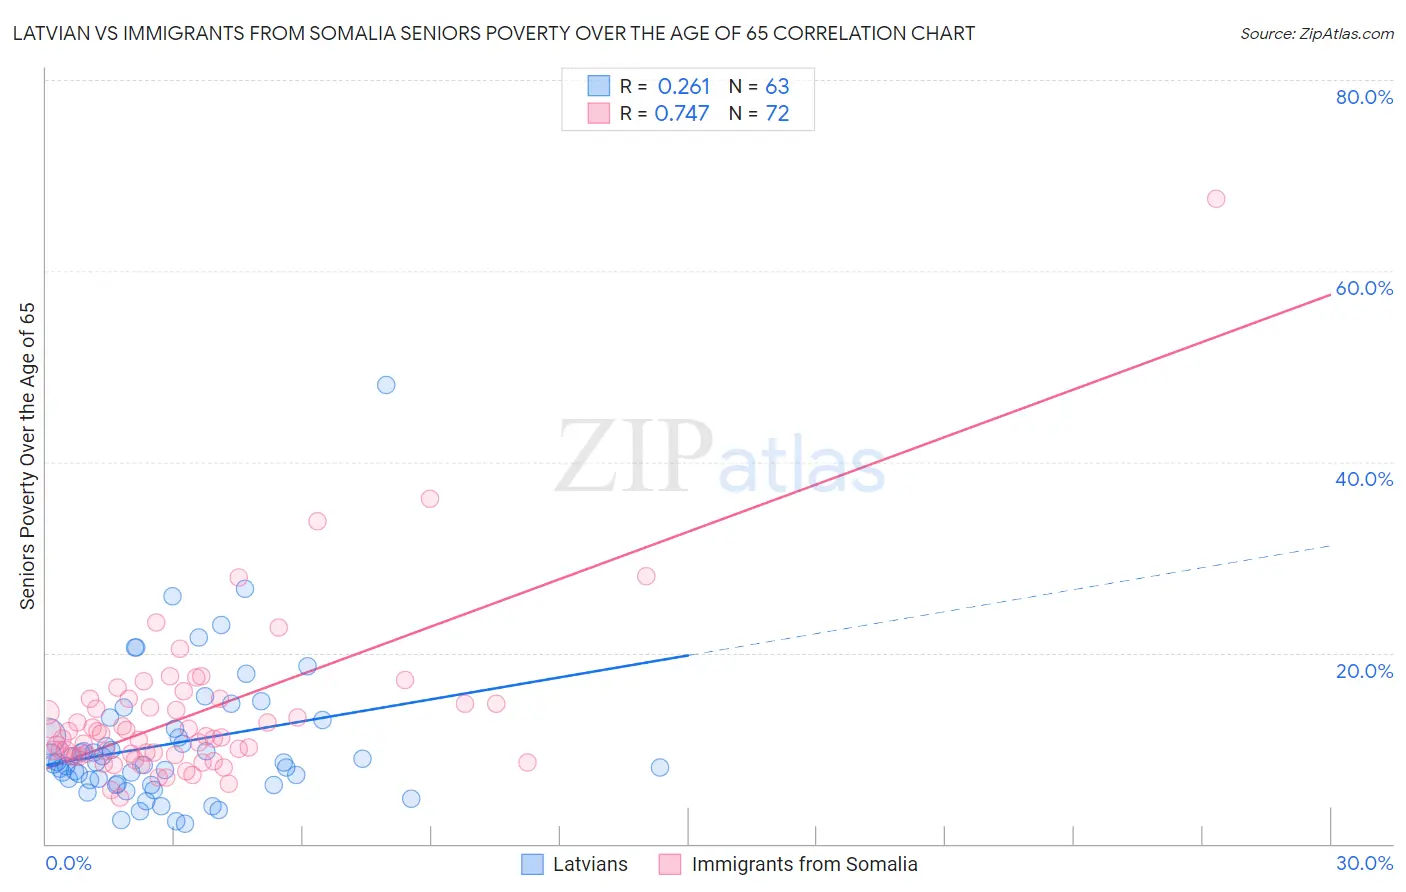
Latvian vs Immigrants from Somalia Seniors Poverty Over the Age of 65 Correlation Chart
The statistical analysis conducted on geographies consisting of 220,200,877 people shows a weak positive correlation between the proportion of Latvians and poverty level among seniors over the age of 65 in the United States with a correlation coefficient (R) of 0.261 and weighted average of 9.5%. Similarly, the statistical analysis conducted on geographies consisting of 92,073,309 people shows a strong positive correlation between the proportion of Immigrants from Somalia and poverty level among seniors over the age of 65 in the United States with a correlation coefficient (R) of 0.747 and weighted average of 12.6%, a difference of 33.5%.
Seniors Poverty Over the Age of 65 Correlation Summary
| Measurement | Latvian | Immigrants from Somalia |
| Minimum | 2.0% | 4.8% |
| Maximum | 48.0% | 67.5% |
| Range | 46.0% | 62.7% |
| Mean | 10.5% | 13.6% |
| Median | 8.5% | 11.1% |
| Interquartile 25% (IQ1) | 6.3% | 9.3% |
| Interquartile 75% (IQ3) | 12.0% | 14.9% |
| Interquartile Range (IQR) | 5.7% | 5.7% |
| Standard Deviation (Sample) | 7.4% | 8.8% |
| Standard Deviation (Population) | 7.3% | 8.7% |
Similar Demographics by Seniors Poverty Over the Age of 65
Demographics Similar to Latvians by Seniors Poverty Over the Age of 65
In terms of seniors poverty over the age of 65, the demographic groups most similar to Latvians are Czechoslovakian (9.5%, a difference of 0.050%), British (9.4%, a difference of 0.38%), Native Hawaiian (9.4%, a difference of 0.48%), Northern European (9.4%, a difference of 0.50%), and Scotch-Irish (9.5%, a difference of 0.55%).
| Demographics | Rating | Rank | Seniors Poverty Over the Age of 65 |
| Tongans | 99.9 /100 | #28 | Exceptional 9.3% |
| Bhutanese | 99.9 /100 | #29 | Exceptional 9.3% |
| Menominee | 99.8 /100 | #30 | Exceptional 9.4% |
| Finns | 99.8 /100 | #31 | Exceptional 9.4% |
| Northern Europeans | 99.8 /100 | #32 | Exceptional 9.4% |
| Native Hawaiians | 99.8 /100 | #33 | Exceptional 9.4% |
| British | 99.8 /100 | #34 | Exceptional 9.4% |
| Latvians | 99.8 /100 | #35 | Exceptional 9.5% |
| Czechoslovakians | 99.8 /100 | #36 | Exceptional 9.5% |
| Scotch-Irish | 99.7 /100 | #37 | Exceptional 9.5% |
| Belgians | 99.7 /100 | #38 | Exceptional 9.5% |
| Greeks | 99.6 /100 | #39 | Exceptional 9.6% |
| Assyrians/Chaldeans/Syriacs | 99.6 /100 | #40 | Exceptional 9.6% |
| Immigrants | North Macedonia | 99.6 /100 | #41 | Exceptional 9.6% |
| Zimbabweans | 99.6 /100 | #42 | Exceptional 9.6% |
Demographics Similar to Immigrants from Somalia by Seniors Poverty Over the Age of 65
In terms of seniors poverty over the age of 65, the demographic groups most similar to Immigrants from Somalia are Blackfeet (12.6%, a difference of 0.10%), African (12.6%, a difference of 0.24%), Immigrants from Western Africa (12.6%, a difference of 0.41%), Inupiat (12.6%, a difference of 0.50%), and Soviet Union (12.6%, a difference of 0.57%).
| Demographics | Rating | Rank | Seniors Poverty Over the Age of 65 |
| Colombians | 0.2 /100 | #261 | Tragic 12.5% |
| Venezuelans | 0.1 /100 | #262 | Tragic 12.5% |
| Soviet Union | 0.1 /100 | #263 | Tragic 12.6% |
| Inupiat | 0.1 /100 | #264 | Tragic 12.6% |
| Immigrants | Western Africa | 0.1 /100 | #265 | Tragic 12.6% |
| Africans | 0.1 /100 | #266 | Tragic 12.6% |
| Blackfeet | 0.1 /100 | #267 | Tragic 12.6% |
| Immigrants | Somalia | 0.1 /100 | #268 | Tragic 12.6% |
| Immigrants | Venezuela | 0.1 /100 | #269 | Tragic 12.7% |
| Immigrants | South America | 0.1 /100 | #270 | Tragic 12.7% |
| Immigrants | Ghana | 0.1 /100 | #271 | Tragic 12.8% |
| Immigrants | Uruguay | 0.1 /100 | #272 | Tragic 12.8% |
| Kiowa | 0.0 /100 | #273 | Tragic 12.8% |
| Salvadorans | 0.0 /100 | #274 | Tragic 12.8% |
| Immigrants | Colombia | 0.0 /100 | #275 | Tragic 12.9% |