Indian (Asian) vs Hopi Seniors Poverty Over the Age of 65
COMPARE
Indian (Asian)
Hopi
Seniors Poverty Over the Age of 65
Seniors Poverty Over the Age of 65 Comparison
Indians (Asian)
Hopi
11.1%
SENIORS POVERTY OVER THE AGE OF 65
34.2/ 100
METRIC RATING
190th/ 347
METRIC RANK
17.8%
SENIORS POVERTY OVER THE AGE OF 65
0.0/ 100
METRIC RATING
340th/ 347
METRIC RANK
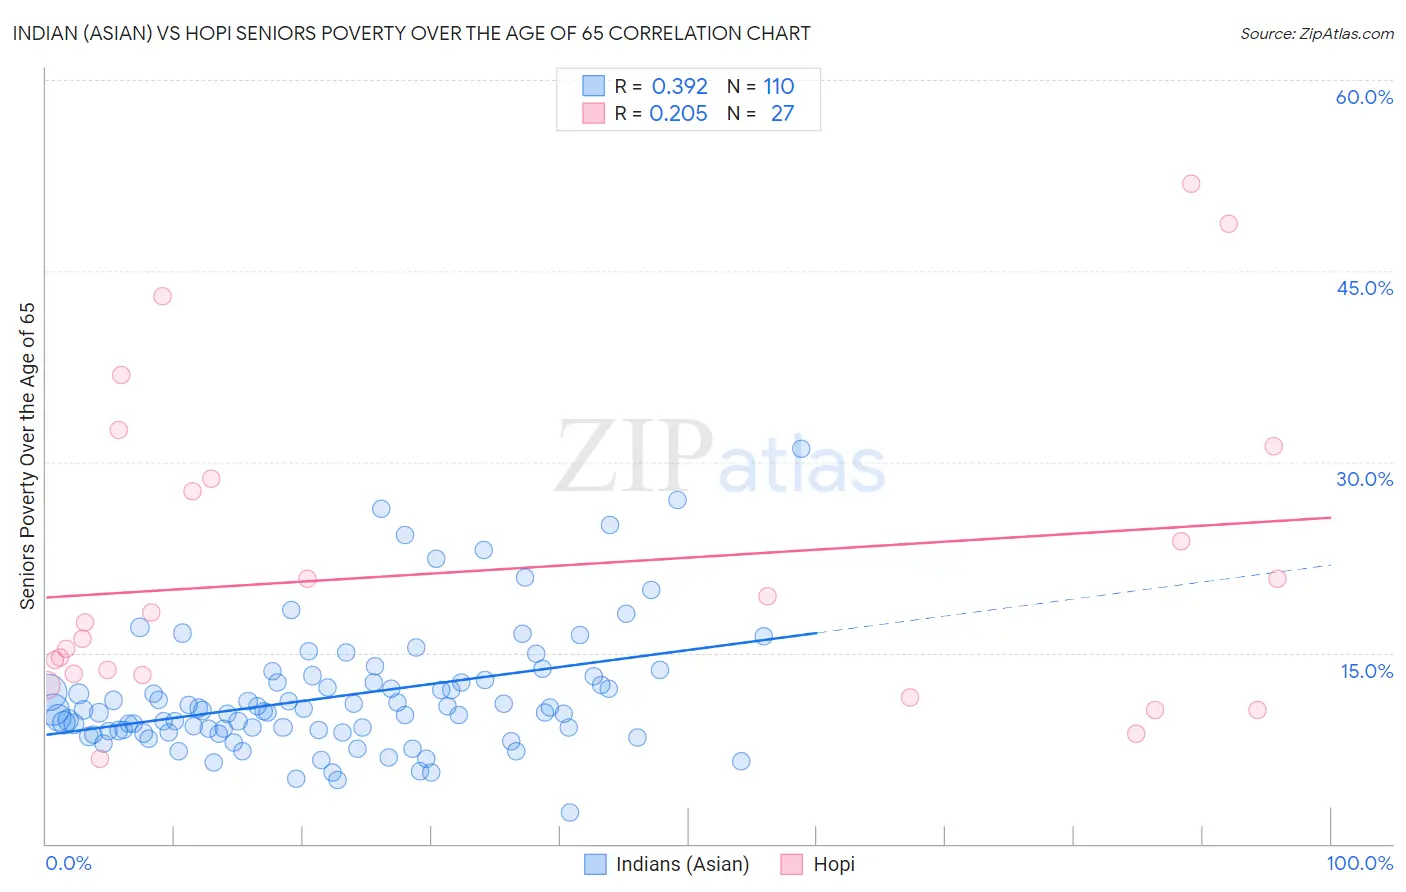
Indian (Asian) vs Hopi Seniors Poverty Over the Age of 65 Correlation Chart
The statistical analysis conducted on geographies consisting of 492,457,214 people shows a mild positive correlation between the proportion of Indians (Asian) and poverty level among seniors over the age of 65 in the United States with a correlation coefficient (R) of 0.392 and weighted average of 11.1%. Similarly, the statistical analysis conducted on geographies consisting of 74,556,917 people shows a weak positive correlation between the proportion of Hopi and poverty level among seniors over the age of 65 in the United States with a correlation coefficient (R) of 0.205 and weighted average of 17.8%, a difference of 60.3%.
Seniors Poverty Over the Age of 65 Correlation Summary
| Measurement | Indian (Asian) | Hopi |
| Minimum | 2.4% | 6.7% |
| Maximum | 31.1% | 51.9% |
| Range | 28.6% | 45.2% |
| Mean | 11.6% | 21.6% |
| Median | 10.4% | 17.4% |
| Interquartile 25% (IQ1) | 8.9% | 13.3% |
| Interquartile 75% (IQ3) | 12.7% | 28.7% |
| Interquartile Range (IQR) | 3.8% | 15.4% |
| Standard Deviation (Sample) | 4.9% | 12.2% |
| Standard Deviation (Population) | 4.9% | 12.0% |
Similar Demographics by Seniors Poverty Over the Age of 65
Demographics Similar to Indians (Asian) by Seniors Poverty Over the Age of 65
In terms of seniors poverty over the age of 65, the demographic groups most similar to Indians (Asian) are Immigrants from Laos (11.1%, a difference of 0.15%), Immigrants from Uganda (11.1%, a difference of 0.20%), Immigrants from Hong Kong (11.1%, a difference of 0.21%), Immigrants from Middle Africa (11.1%, a difference of 0.31%), and Immigrants from Eastern Asia (11.1%, a difference of 0.32%).
| Demographics | Rating | Rank | Seniors Poverty Over the Age of 65 |
| Immigrants | Kazakhstan | 41.0 /100 | #183 | Average 11.0% |
| Immigrants | France | 40.9 /100 | #184 | Average 11.0% |
| Immigrants | Lebanon | 38.2 /100 | #185 | Fair 11.1% |
| Immigrants | Eastern Asia | 37.5 /100 | #186 | Fair 11.1% |
| Immigrants | Middle Africa | 37.4 /100 | #187 | Fair 11.1% |
| Immigrants | Hong Kong | 36.3 /100 | #188 | Fair 11.1% |
| Immigrants | Laos | 35.7 /100 | #189 | Fair 11.1% |
| Indians (Asian) | 34.2 /100 | #190 | Fair 11.1% |
| Immigrants | Uganda | 32.2 /100 | #191 | Fair 11.1% |
| Immigrants | Southern Europe | 30.1 /100 | #192 | Fair 11.1% |
| Taiwanese | 29.2 /100 | #193 | Fair 11.2% |
| Chileans | 27.8 /100 | #194 | Fair 11.2% |
| Immigrants | Vietnam | 26.6 /100 | #195 | Fair 11.2% |
| Bangladeshis | 25.2 /100 | #196 | Fair 11.2% |
| Albanians | 24.4 /100 | #197 | Fair 11.2% |
Demographics Similar to Hopi by Seniors Poverty Over the Age of 65
In terms of seniors poverty over the age of 65, the demographic groups most similar to Hopi are Dominican (17.8%, a difference of 0.39%), Immigrants from Cuba (17.9%, a difference of 0.87%), Navajo (17.5%, a difference of 1.9%), Lumbee (18.1%, a difference of 2.0%), and Immigrants from Dominican Republic (18.3%, a difference of 2.9%).
| Demographics | Rating | Rank | Seniors Poverty Over the Age of 65 |
| Immigrants | Yemen | 0.0 /100 | #333 | Tragic 15.9% |
| Immigrants | Nicaragua | 0.0 /100 | #334 | Tragic 15.9% |
| Cubans | 0.0 /100 | #335 | Tragic 16.1% |
| Immigrants | Cabo Verde | 0.0 /100 | #336 | Tragic 16.2% |
| Immigrants | Caribbean | 0.0 /100 | #337 | Tragic 16.5% |
| Pueblo | 0.0 /100 | #338 | Tragic 17.2% |
| Navajo | 0.0 /100 | #339 | Tragic 17.5% |
| Hopi | 0.0 /100 | #340 | Tragic 17.8% |
| Dominicans | 0.0 /100 | #341 | Tragic 17.8% |
| Immigrants | Cuba | 0.0 /100 | #342 | Tragic 17.9% |
| Lumbee | 0.0 /100 | #343 | Tragic 18.1% |
| Immigrants | Dominican Republic | 0.0 /100 | #344 | Tragic 18.3% |
| Pima | 0.0 /100 | #345 | Tragic 19.8% |
| Tohono O'odham | 0.0 /100 | #346 | Tragic 20.8% |
| Puerto Ricans | 0.0 /100 | #347 | Tragic 21.4% |