Laotian vs Costa Rican Single Mother Poverty
COMPARE
Laotian
Costa Rican
Single Mother Poverty
Single Mother Poverty Comparison
Laotians
Costa Ricans
27.0%
SINGLE MOTHER POVERTY
99.8/ 100
METRIC RATING
50th/ 347
METRIC RANK
29.0%
SINGLE MOTHER POVERTY
58.4/ 100
METRIC RATING
167th/ 347
METRIC RANK
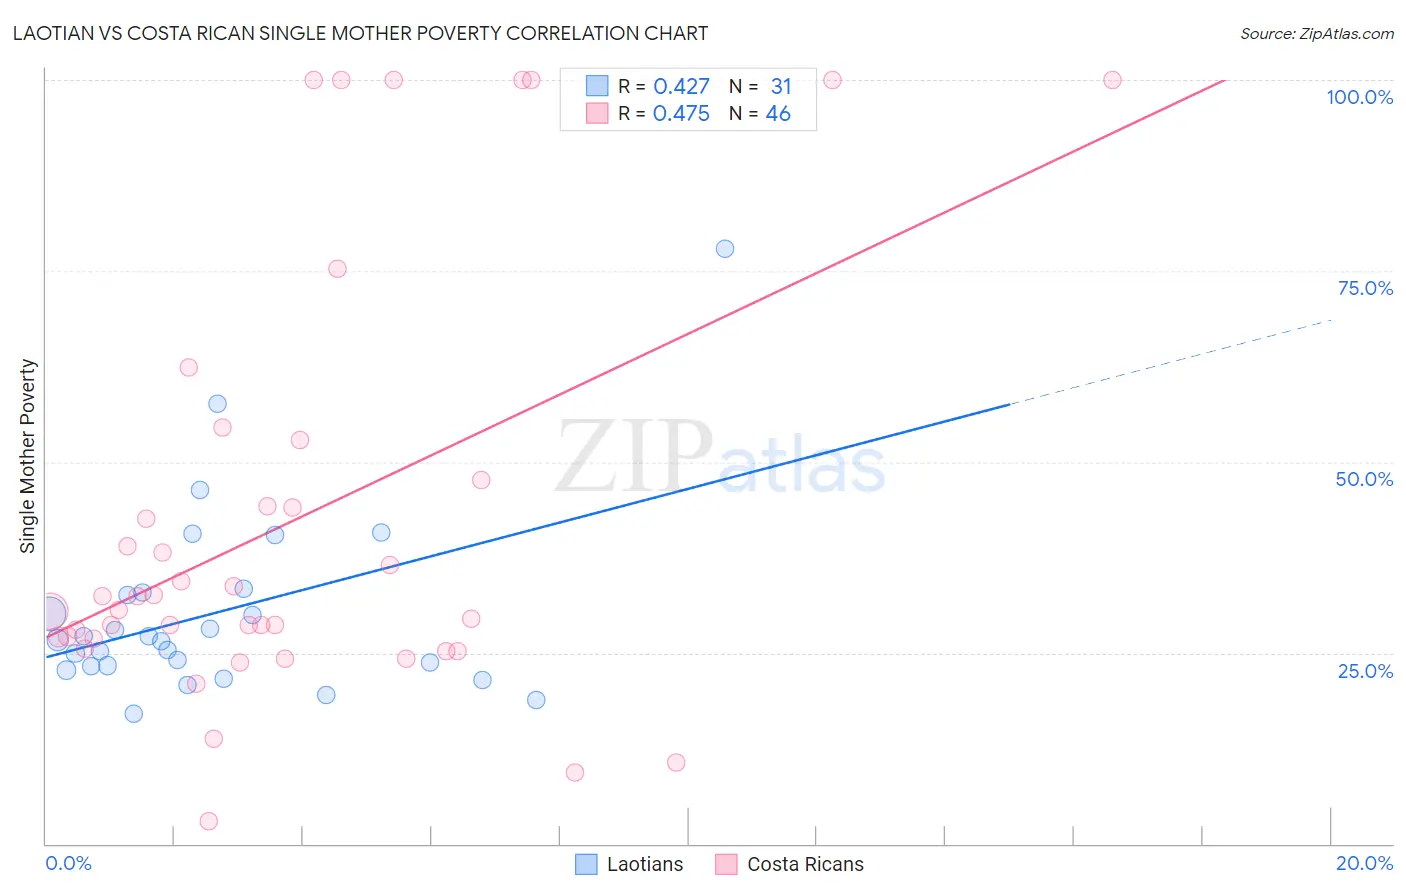
Laotian vs Costa Rican Single Mother Poverty Correlation Chart
The statistical analysis conducted on geographies consisting of 221,717,898 people shows a moderate positive correlation between the proportion of Laotians and poverty level among single mothers in the United States with a correlation coefficient (R) of 0.427 and weighted average of 27.0%. Similarly, the statistical analysis conducted on geographies consisting of 249,968,027 people shows a moderate positive correlation between the proportion of Costa Ricans and poverty level among single mothers in the United States with a correlation coefficient (R) of 0.475 and weighted average of 29.0%, a difference of 7.8%.
Single Mother Poverty Correlation Summary
| Measurement | Laotian | Costa Rican |
| Minimum | 17.0% | 3.0% |
| Maximum | 78.0% | 100.0% |
| Range | 60.9% | 97.0% |
| Mean | 30.2% | 42.4% |
| Median | 26.6% | 31.5% |
| Interquartile 25% (IQ1) | 23.3% | 26.9% |
| Interquartile 75% (IQ3) | 32.8% | 47.6% |
| Interquartile Range (IQR) | 9.6% | 20.7% |
| Standard Deviation (Sample) | 12.5% | 27.7% |
| Standard Deviation (Population) | 12.3% | 27.4% |
Similar Demographics by Single Mother Poverty
Demographics Similar to Laotians by Single Mother Poverty
In terms of single mother poverty, the demographic groups most similar to Laotians are Cambodian (27.0%, a difference of 0.010%), Immigrants from Poland (26.9%, a difference of 0.090%), Egyptian (26.9%, a difference of 0.17%), Immigrants from Serbia (26.9%, a difference of 0.23%), and Latvian (26.9%, a difference of 0.27%).
| Demographics | Rating | Rank | Single Mother Poverty |
| Tsimshian | 99.9 /100 | #43 | Exceptional 26.8% |
| Immigrants | Sierra Leone | 99.9 /100 | #44 | Exceptional 26.9% |
| Latvians | 99.9 /100 | #45 | Exceptional 26.9% |
| Immigrants | Serbia | 99.9 /100 | #46 | Exceptional 26.9% |
| Egyptians | 99.8 /100 | #47 | Exceptional 26.9% |
| Immigrants | Poland | 99.8 /100 | #48 | Exceptional 26.9% |
| Cambodians | 99.8 /100 | #49 | Exceptional 27.0% |
| Laotians | 99.8 /100 | #50 | Exceptional 27.0% |
| Immigrants | Argentina | 99.7 /100 | #51 | Exceptional 27.1% |
| Immigrants | South Eastern Asia | 99.7 /100 | #52 | Exceptional 27.1% |
| Immigrants | Jordan | 99.7 /100 | #53 | Exceptional 27.1% |
| Immigrants | Bulgaria | 99.7 /100 | #54 | Exceptional 27.1% |
| Immigrants | Egypt | 99.7 /100 | #55 | Exceptional 27.1% |
| Immigrants | Romania | 99.7 /100 | #56 | Exceptional 27.2% |
| Palestinians | 99.7 /100 | #57 | Exceptional 27.2% |
Demographics Similar to Costa Ricans by Single Mother Poverty
In terms of single mother poverty, the demographic groups most similar to Costa Ricans are European (29.1%, a difference of 0.040%), Immigrants from Uruguay (29.1%, a difference of 0.060%), Inupiat (29.0%, a difference of 0.10%), Arab (29.0%, a difference of 0.12%), and New Zealander (29.1%, a difference of 0.16%).
| Demographics | Rating | Rank | Single Mother Poverty |
| Japanese | 68.0 /100 | #160 | Good 28.9% |
| Immigrants | Cambodia | 66.6 /100 | #161 | Good 28.9% |
| Scandinavians | 66.2 /100 | #162 | Good 28.9% |
| Immigrants | Nigeria | 65.9 /100 | #163 | Good 28.9% |
| Immigrants | Kenya | 65.9 /100 | #164 | Good 28.9% |
| Arabs | 60.7 /100 | #165 | Good 29.0% |
| Inupiat | 60.4 /100 | #166 | Good 29.0% |
| Costa Ricans | 58.4 /100 | #167 | Average 29.0% |
| Europeans | 57.6 /100 | #168 | Average 29.1% |
| Immigrants | Uruguay | 57.2 /100 | #169 | Average 29.1% |
| New Zealanders | 55.1 /100 | #170 | Average 29.1% |
| Puget Sound Salish | 55.1 /100 | #171 | Average 29.1% |
| Carpatho Rusyns | 53.8 /100 | #172 | Average 29.1% |
| British | 50.6 /100 | #173 | Average 29.2% |
| Immigrants | Saudi Arabia | 50.0 /100 | #174 | Average 29.2% |