Korean vs Immigrants from Argentina Single Female Poverty
COMPARE
Korean
Immigrants from Argentina
Single Female Poverty
Single Female Poverty Comparison
Koreans
Immigrants from Argentina
18.6%
SINGLE FEMALE POVERTY
99.9/ 100
METRIC RATING
34th/ 347
METRIC RANK
19.0%
SINGLE FEMALE POVERTY
99.8/ 100
METRIC RATING
48th/ 347
METRIC RANK
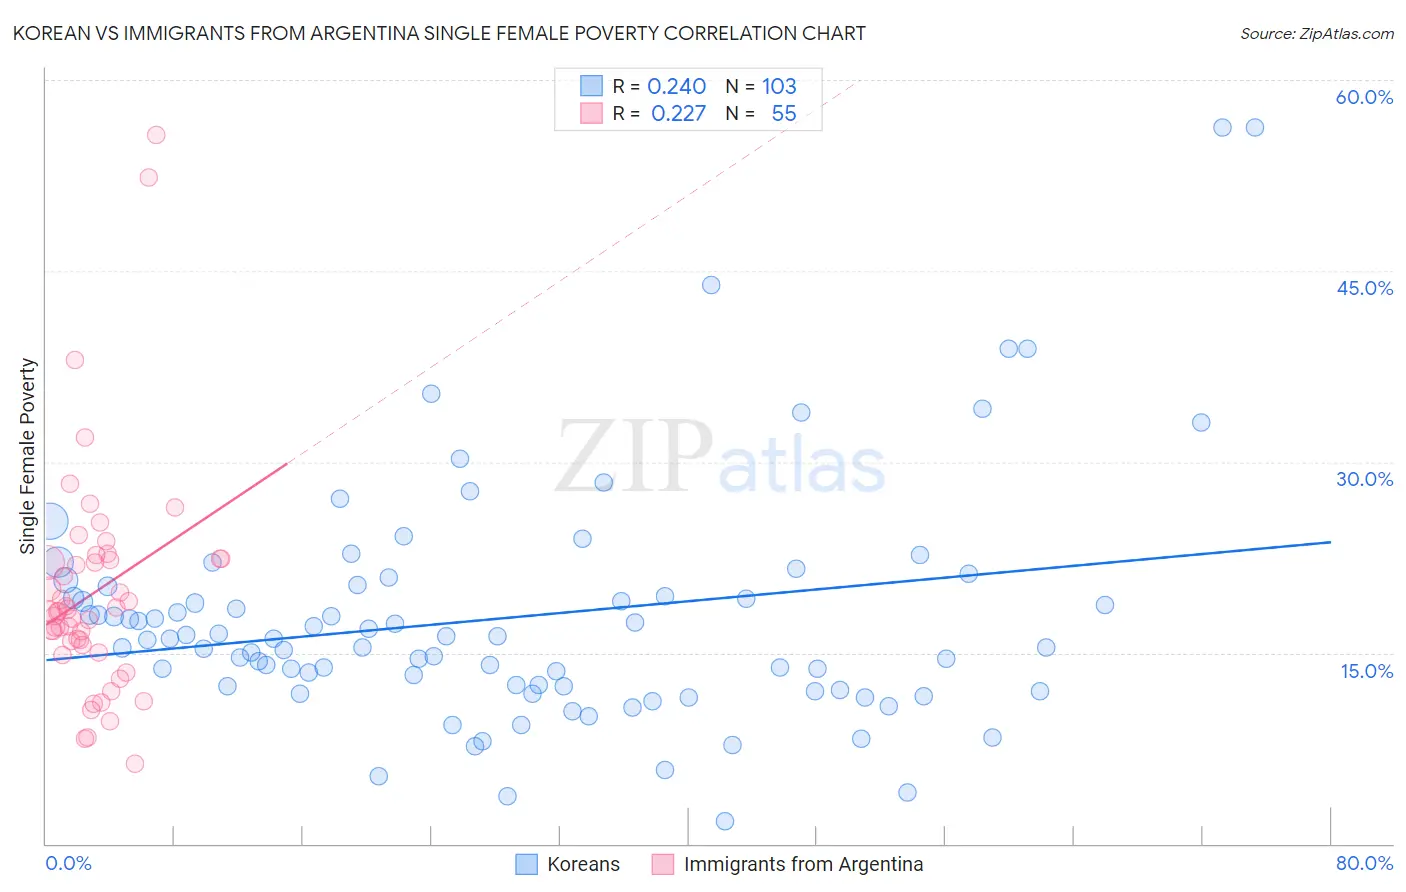
Korean vs Immigrants from Argentina Single Female Poverty Correlation Chart
The statistical analysis conducted on geographies consisting of 499,036,365 people shows a weak positive correlation between the proportion of Koreans and poverty level among single females in the United States with a correlation coefficient (R) of 0.240 and weighted average of 18.6%. Similarly, the statistical analysis conducted on geographies consisting of 261,466,881 people shows a weak positive correlation between the proportion of Immigrants from Argentina and poverty level among single females in the United States with a correlation coefficient (R) of 0.227 and weighted average of 19.0%, a difference of 2.2%.
Single Female Poverty Correlation Summary
| Measurement | Korean | Immigrants from Argentina |
| Minimum | 1.8% | 6.3% |
| Maximum | 56.2% | 55.7% |
| Range | 54.5% | 49.4% |
| Mean | 17.8% | 19.7% |
| Median | 16.1% | 18.2% |
| Interquartile 25% (IQ1) | 12.4% | 15.6% |
| Interquartile 75% (IQ3) | 20.2% | 22.4% |
| Interquartile Range (IQR) | 7.8% | 6.9% |
| Standard Deviation (Sample) | 9.3% | 8.9% |
| Standard Deviation (Population) | 9.3% | 8.8% |
Demographics Similar to Koreans and Immigrants from Argentina by Single Female Poverty
In terms of single female poverty, the demographic groups most similar to Koreans are Immigrants from Japan (18.6%, a difference of 0.060%), Immigrants from Philippines (18.6%, a difference of 0.18%), Turkish (18.7%, a difference of 0.24%), Immigrants from Sri Lanka (18.6%, a difference of 0.25%), and Immigrants from Armenia (18.7%, a difference of 0.26%). Similarly, the demographic groups most similar to Immigrants from Argentina are Immigrants from Czechoslovakia (19.0%, a difference of 0.010%), Immigrants from Eastern Europe (19.0%, a difference of 0.050%), Immigrants from Italy (19.0%, a difference of 0.090%), Latvian (19.0%, a difference of 0.28%), and Macedonian (18.9%, a difference of 0.46%).
| Demographics | Rating | Rank | Single Female Poverty |
| Immigrants | Asia | 99.9 /100 | #31 | Exceptional 18.6% |
| Immigrants | Sri Lanka | 99.9 /100 | #32 | Exceptional 18.6% |
| Immigrants | Philippines | 99.9 /100 | #33 | Exceptional 18.6% |
| Koreans | 99.9 /100 | #34 | Exceptional 18.6% |
| Immigrants | Japan | 99.9 /100 | #35 | Exceptional 18.6% |
| Turks | 99.9 /100 | #36 | Exceptional 18.7% |
| Immigrants | Armenia | 99.9 /100 | #37 | Exceptional 18.7% |
| Tongans | 99.9 /100 | #38 | Exceptional 18.8% |
| Bulgarians | 99.9 /100 | #39 | Exceptional 18.8% |
| Okinawans | 99.9 /100 | #40 | Exceptional 18.8% |
| Immigrants | Serbia | 99.9 /100 | #41 | Exceptional 18.8% |
| Jordanians | 99.9 /100 | #42 | Exceptional 18.8% |
| Immigrants | Romania | 99.9 /100 | #43 | Exceptional 18.8% |
| Immigrants | Croatia | 99.9 /100 | #44 | Exceptional 18.9% |
| Immigrants | Indonesia | 99.8 /100 | #45 | Exceptional 18.9% |
| Macedonians | 99.8 /100 | #46 | Exceptional 18.9% |
| Latvians | 99.8 /100 | #47 | Exceptional 19.0% |
| Immigrants | Argentina | 99.8 /100 | #48 | Exceptional 19.0% |
| Immigrants | Czechoslovakia | 99.8 /100 | #49 | Exceptional 19.0% |
| Immigrants | Eastern Europe | 99.8 /100 | #50 | Exceptional 19.0% |
| Immigrants | Italy | 99.8 /100 | #51 | Exceptional 19.0% |