Kiowa vs Sri Lankan Family Poverty
COMPARE
Kiowa
Sri Lankan
Family Poverty
Family Poverty Comparison
Kiowa
Sri Lankans
12.2%
FAMILY POVERTY
0.0/ 100
METRIC RATING
314th/ 347
METRIC RANK
8.5%
FAMILY POVERTY
86.6/ 100
METRIC RATING
133rd/ 347
METRIC RANK
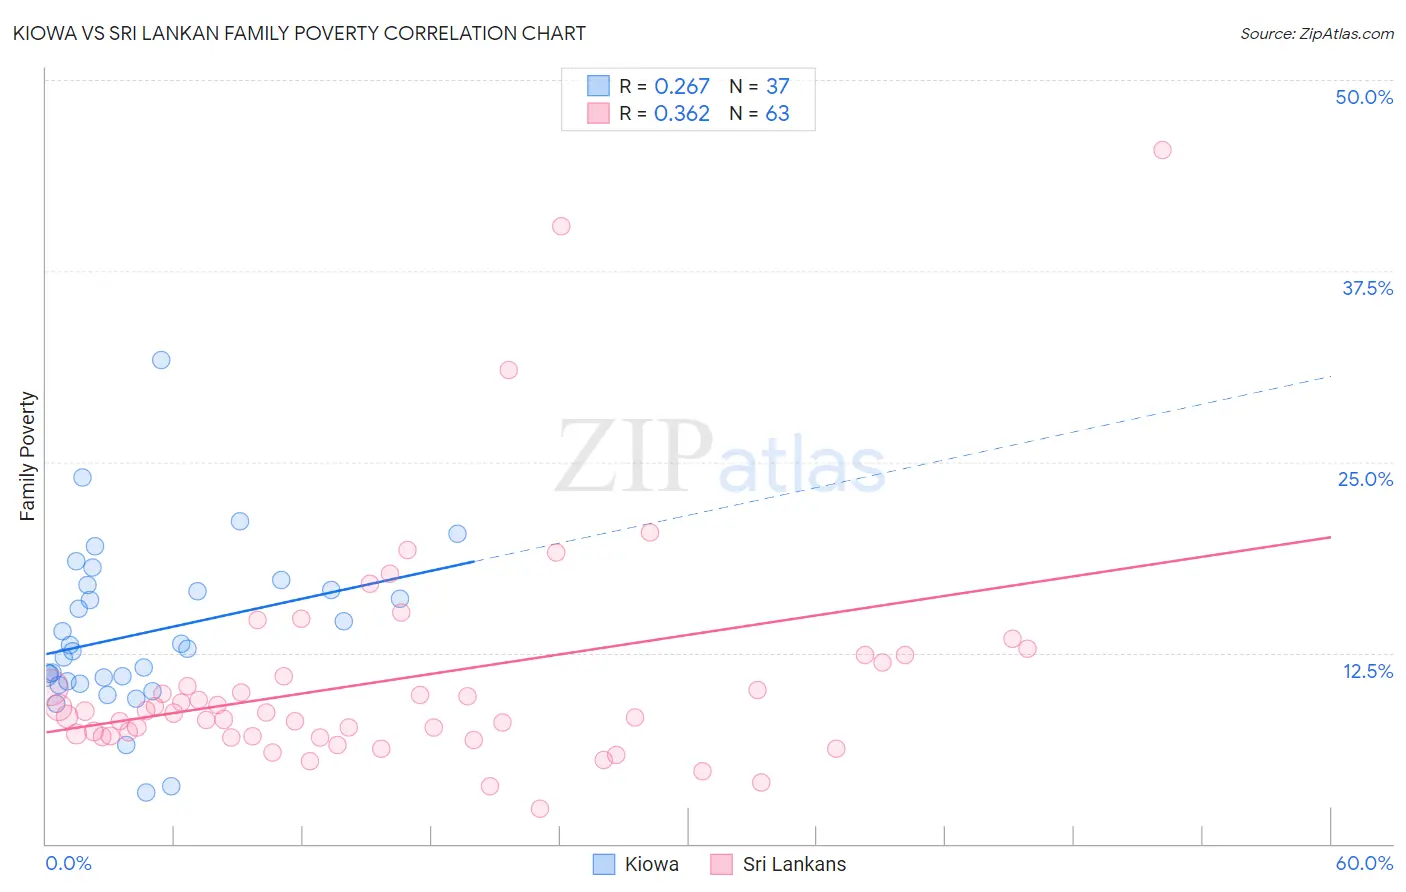
Kiowa vs Sri Lankan Family Poverty Correlation Chart
The statistical analysis conducted on geographies consisting of 56,081,442 people shows a weak positive correlation between the proportion of Kiowa and poverty level among families in the United States with a correlation coefficient (R) of 0.267 and weighted average of 12.2%. Similarly, the statistical analysis conducted on geographies consisting of 439,246,520 people shows a mild positive correlation between the proportion of Sri Lankans and poverty level among families in the United States with a correlation coefficient (R) of 0.362 and weighted average of 8.5%, a difference of 44.8%.
Family Poverty Correlation Summary
| Measurement | Kiowa | Sri Lankan |
| Minimum | 3.4% | 2.3% |
| Maximum | 31.6% | 45.5% |
| Range | 28.3% | 43.2% |
| Mean | 13.8% | 10.8% |
| Median | 12.8% | 8.6% |
| Interquartile 25% (IQ1) | 10.6% | 7.0% |
| Interquartile 75% (IQ3) | 16.8% | 11.9% |
| Interquartile Range (IQR) | 6.2% | 4.8% |
| Standard Deviation (Sample) | 5.4% | 7.5% |
| Standard Deviation (Population) | 5.3% | 7.4% |
Similar Demographics by Family Poverty
Demographics Similar to Kiowa by Family Poverty
In terms of family poverty, the demographic groups most similar to Kiowa are Immigrants from Mexico (12.3%, a difference of 0.26%), Immigrants from Caribbean (12.2%, a difference of 0.50%), Honduran (12.4%, a difference of 1.0%), Immigrants from Central America (12.1%, a difference of 1.2%), and Immigrants from Grenada (12.4%, a difference of 1.2%).
| Demographics | Rating | Rank | Family Poverty |
| Immigrants | Congo | 0.0 /100 | #307 | Tragic 11.9% |
| Seminole | 0.0 /100 | #308 | Tragic 11.9% |
| Hispanics or Latinos | 0.0 /100 | #309 | Tragic 12.0% |
| Immigrants | Guatemala | 0.0 /100 | #310 | Tragic 12.0% |
| Ute | 0.0 /100 | #311 | Tragic 12.1% |
| Immigrants | Central America | 0.0 /100 | #312 | Tragic 12.1% |
| Immigrants | Caribbean | 0.0 /100 | #313 | Tragic 12.2% |
| Kiowa | 0.0 /100 | #314 | Tragic 12.2% |
| Immigrants | Mexico | 0.0 /100 | #315 | Tragic 12.3% |
| Hondurans | 0.0 /100 | #316 | Tragic 12.4% |
| Immigrants | Grenada | 0.0 /100 | #317 | Tragic 12.4% |
| U.S. Virgin Islanders | 0.0 /100 | #318 | Tragic 12.4% |
| British West Indians | 0.0 /100 | #319 | Tragic 12.4% |
| Inupiat | 0.0 /100 | #320 | Tragic 12.5% |
| Arapaho | 0.0 /100 | #321 | Tragic 12.7% |
Demographics Similar to Sri Lankans by Family Poverty
In terms of family poverty, the demographic groups most similar to Sri Lankans are Chilean (8.5%, a difference of 0.010%), Immigrants from Malaysia (8.5%, a difference of 0.050%), Immigrants from Brazil (8.5%, a difference of 0.090%), Immigrants from Southern Europe (8.5%, a difference of 0.17%), and Immigrants from Argentina (8.4%, a difference of 0.50%).
| Demographics | Rating | Rank | Family Poverty |
| Icelanders | 90.3 /100 | #126 | Exceptional 8.3% |
| Immigrants | Hungary | 89.9 /100 | #127 | Excellent 8.4% |
| Argentineans | 89.6 /100 | #128 | Excellent 8.4% |
| Portuguese | 89.2 /100 | #129 | Excellent 8.4% |
| Immigrants | Bosnia and Herzegovina | 88.6 /100 | #130 | Excellent 8.4% |
| Puget Sound Salish | 88.6 /100 | #131 | Excellent 8.4% |
| Immigrants | Argentina | 88.2 /100 | #132 | Excellent 8.4% |
| Sri Lankans | 86.6 /100 | #133 | Excellent 8.5% |
| Chileans | 86.6 /100 | #134 | Excellent 8.5% |
| Immigrants | Malaysia | 86.5 /100 | #135 | Excellent 8.5% |
| Immigrants | Brazil | 86.3 /100 | #136 | Excellent 8.5% |
| Immigrants | Southern Europe | 86.0 /100 | #137 | Excellent 8.5% |
| Armenians | 84.6 /100 | #138 | Excellent 8.5% |
| Immigrants | Nepal | 84.2 /100 | #139 | Excellent 8.5% |
| Immigrants | Kazakhstan | 84.1 /100 | #140 | Excellent 8.5% |