Immigrants from Mexico vs Sri Lankan Family Poverty
COMPARE
Immigrants from Mexico
Sri Lankan
Family Poverty
Family Poverty Comparison
Immigrants from Mexico
Sri Lankans
12.3%
FAMILY POVERTY
0.0/ 100
METRIC RATING
315th/ 347
METRIC RANK
8.5%
FAMILY POVERTY
86.6/ 100
METRIC RATING
133rd/ 347
METRIC RANK
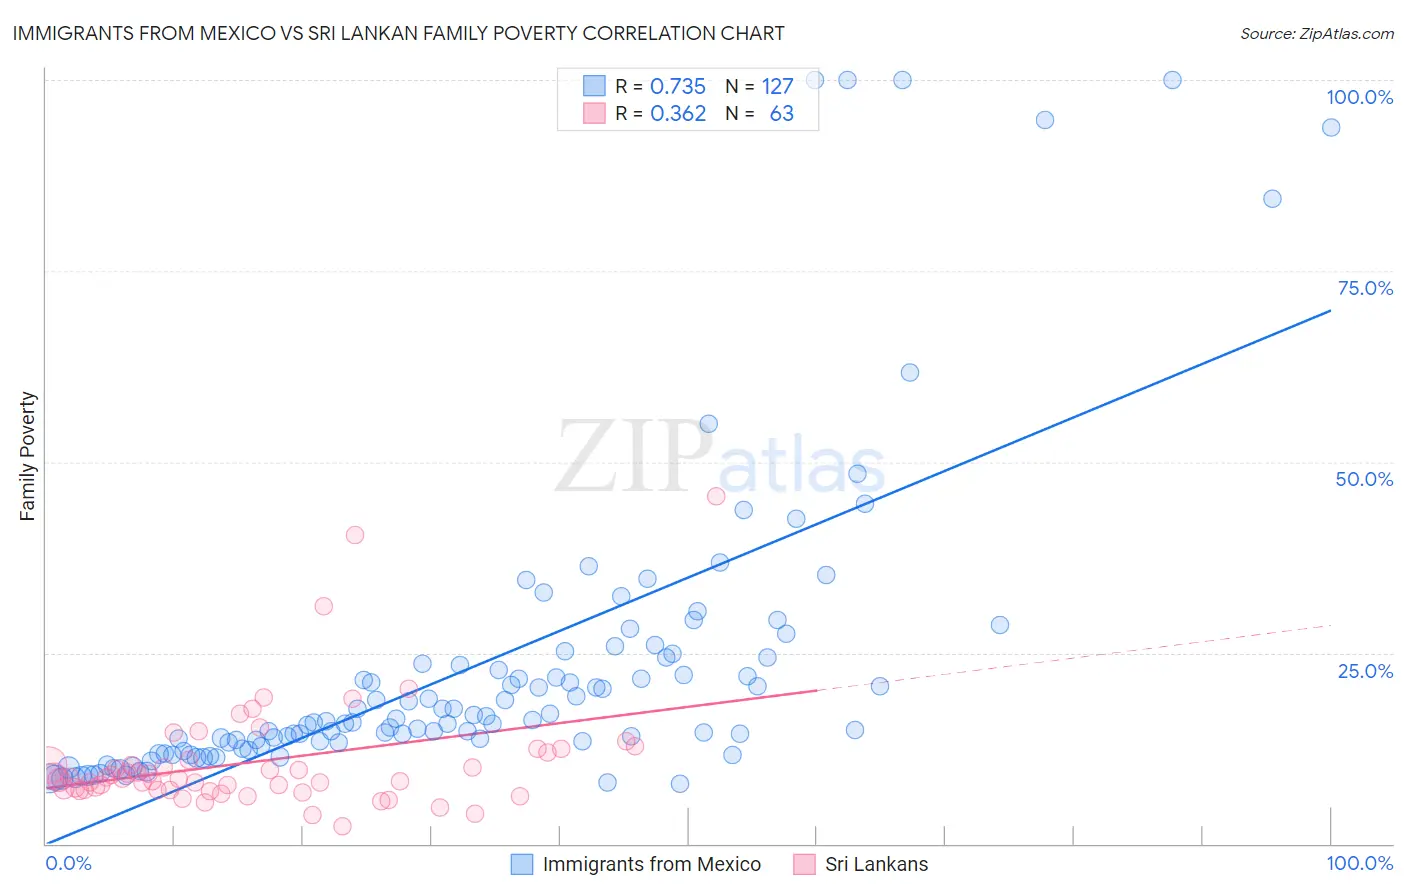
Immigrants from Mexico vs Sri Lankan Family Poverty Correlation Chart
The statistical analysis conducted on geographies consisting of 511,802,824 people shows a strong positive correlation between the proportion of Immigrants from Mexico and poverty level among families in the United States with a correlation coefficient (R) of 0.735 and weighted average of 12.3%. Similarly, the statistical analysis conducted on geographies consisting of 439,246,520 people shows a mild positive correlation between the proportion of Sri Lankans and poverty level among families in the United States with a correlation coefficient (R) of 0.362 and weighted average of 8.5%, a difference of 45.2%.
Family Poverty Correlation Summary
| Measurement | Immigrants from Mexico | Sri Lankan |
| Minimum | 7.9% | 2.3% |
| Maximum | 100.0% | 45.5% |
| Range | 92.1% | 43.2% |
| Mean | 23.1% | 10.8% |
| Median | 15.9% | 8.6% |
| Interquartile 25% (IQ1) | 12.5% | 7.0% |
| Interquartile 75% (IQ3) | 24.4% | 11.9% |
| Interquartile Range (IQR) | 11.9% | 4.8% |
| Standard Deviation (Sample) | 20.2% | 7.5% |
| Standard Deviation (Population) | 20.1% | 7.4% |
Similar Demographics by Family Poverty
Demographics Similar to Immigrants from Mexico by Family Poverty
In terms of family poverty, the demographic groups most similar to Immigrants from Mexico are Kiowa (12.2%, a difference of 0.26%), Honduran (12.4%, a difference of 0.74%), Immigrants from Caribbean (12.2%, a difference of 0.76%), Immigrants from Grenada (12.4%, a difference of 0.96%), and U.S. Virgin Islander (12.4%, a difference of 0.96%).
| Demographics | Rating | Rank | Family Poverty |
| Seminole | 0.0 /100 | #308 | Tragic 11.9% |
| Hispanics or Latinos | 0.0 /100 | #309 | Tragic 12.0% |
| Immigrants | Guatemala | 0.0 /100 | #310 | Tragic 12.0% |
| Ute | 0.0 /100 | #311 | Tragic 12.1% |
| Immigrants | Central America | 0.0 /100 | #312 | Tragic 12.1% |
| Immigrants | Caribbean | 0.0 /100 | #313 | Tragic 12.2% |
| Kiowa | 0.0 /100 | #314 | Tragic 12.2% |
| Immigrants | Mexico | 0.0 /100 | #315 | Tragic 12.3% |
| Hondurans | 0.0 /100 | #316 | Tragic 12.4% |
| Immigrants | Grenada | 0.0 /100 | #317 | Tragic 12.4% |
| U.S. Virgin Islanders | 0.0 /100 | #318 | Tragic 12.4% |
| British West Indians | 0.0 /100 | #319 | Tragic 12.4% |
| Inupiat | 0.0 /100 | #320 | Tragic 12.5% |
| Arapaho | 0.0 /100 | #321 | Tragic 12.7% |
| Immigrants | Honduras | 0.0 /100 | #322 | Tragic 12.7% |
Demographics Similar to Sri Lankans by Family Poverty
In terms of family poverty, the demographic groups most similar to Sri Lankans are Chilean (8.5%, a difference of 0.010%), Immigrants from Malaysia (8.5%, a difference of 0.050%), Immigrants from Brazil (8.5%, a difference of 0.090%), Immigrants from Southern Europe (8.5%, a difference of 0.17%), and Immigrants from Argentina (8.4%, a difference of 0.50%).
| Demographics | Rating | Rank | Family Poverty |
| Icelanders | 90.3 /100 | #126 | Exceptional 8.3% |
| Immigrants | Hungary | 89.9 /100 | #127 | Excellent 8.4% |
| Argentineans | 89.6 /100 | #128 | Excellent 8.4% |
| Portuguese | 89.2 /100 | #129 | Excellent 8.4% |
| Immigrants | Bosnia and Herzegovina | 88.6 /100 | #130 | Excellent 8.4% |
| Puget Sound Salish | 88.6 /100 | #131 | Excellent 8.4% |
| Immigrants | Argentina | 88.2 /100 | #132 | Excellent 8.4% |
| Sri Lankans | 86.6 /100 | #133 | Excellent 8.5% |
| Chileans | 86.6 /100 | #134 | Excellent 8.5% |
| Immigrants | Malaysia | 86.5 /100 | #135 | Excellent 8.5% |
| Immigrants | Brazil | 86.3 /100 | #136 | Excellent 8.5% |
| Immigrants | Southern Europe | 86.0 /100 | #137 | Excellent 8.5% |
| Armenians | 84.6 /100 | #138 | Excellent 8.5% |
| Immigrants | Nepal | 84.2 /100 | #139 | Excellent 8.5% |
| Immigrants | Kazakhstan | 84.1 /100 | #140 | Excellent 8.5% |