Kiowa vs Immigrants from Armenia Female Poverty Among 18-24 Year Olds
COMPARE
Kiowa
Immigrants from Armenia
Female Poverty Among 18-24 Year Olds
Female Poverty Among 18-24 Year Olds Comparison
Kiowa
Immigrants from Armenia
29.2%
FEMALE POVERTY AMONG 18-24 YEAR OLDS
0.0/ 100
METRIC RATING
342nd/ 347
METRIC RANK
18.9%
FEMALE POVERTY AMONG 18-24 YEAR OLDS
99.2/ 100
METRIC RATING
85th/ 347
METRIC RANK
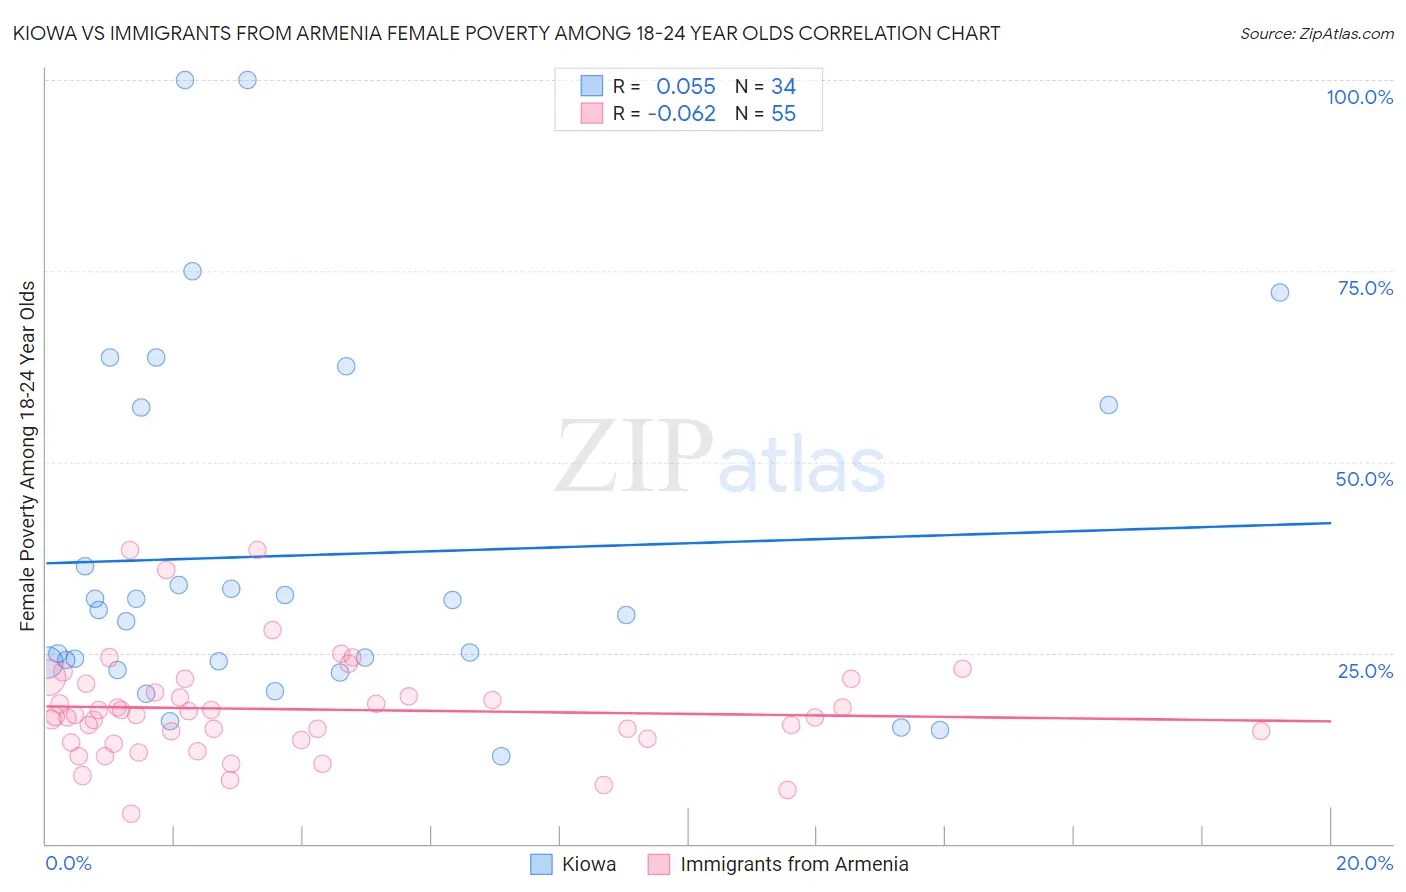
Kiowa vs Immigrants from Armenia Female Poverty Among 18-24 Year Olds Correlation Chart
The statistical analysis conducted on geographies consisting of 55,937,345 people shows a slight positive correlation between the proportion of Kiowa and poverty level among females between the ages 18 and 24 in the United States with a correlation coefficient (R) of 0.055 and weighted average of 29.2%. Similarly, the statistical analysis conducted on geographies consisting of 97,121,428 people shows a slight negative correlation between the proportion of Immigrants from Armenia and poverty level among females between the ages 18 and 24 in the United States with a correlation coefficient (R) of -0.062 and weighted average of 18.9%, a difference of 54.5%.
Female Poverty Among 18-24 Year Olds Correlation Summary
| Measurement | Kiowa | Immigrants from Armenia |
| Minimum | 11.5% | 4.0% |
| Maximum | 100.0% | 38.5% |
| Range | 88.5% | 34.6% |
| Mean | 37.8% | 17.6% |
| Median | 30.3% | 16.8% |
| Interquartile 25% (IQ1) | 23.8% | 13.6% |
| Interquartile 75% (IQ3) | 57.1% | 20.9% |
| Interquartile Range (IQR) | 33.3% | 7.3% |
| Standard Deviation (Sample) | 23.3% | 6.9% |
| Standard Deviation (Population) | 23.0% | 6.8% |
Similar Demographics by Female Poverty Among 18-24 Year Olds
Demographics Similar to Kiowa by Female Poverty Among 18-24 Year Olds
In terms of female poverty among 18-24 year olds, the demographic groups most similar to Kiowa are Colville (29.0%, a difference of 0.74%), Puerto Rican (29.8%, a difference of 2.1%), Sioux (28.6%, a difference of 2.3%), Pima (28.4%, a difference of 2.9%), and Hopi (28.2%, a difference of 3.6%).
| Demographics | Rating | Rank | Female Poverty Among 18-24 Year Olds |
| Apache | 0.0 /100 | #333 | Tragic 26.3% |
| Pueblo | 0.0 /100 | #334 | Tragic 26.9% |
| Yup'ik | 0.0 /100 | #335 | Tragic 27.0% |
| Immigrants | Yemen | 0.0 /100 | #336 | Tragic 27.5% |
| Cheyenne | 0.0 /100 | #337 | Tragic 28.1% |
| Hopi | 0.0 /100 | #338 | Tragic 28.2% |
| Pima | 0.0 /100 | #339 | Tragic 28.4% |
| Sioux | 0.0 /100 | #340 | Tragic 28.6% |
| Colville | 0.0 /100 | #341 | Tragic 29.0% |
| Kiowa | 0.0 /100 | #342 | Tragic 29.2% |
| Puerto Ricans | 0.0 /100 | #343 | Tragic 29.8% |
| Navajo | 0.0 /100 | #344 | Tragic 30.3% |
| Tohono O'odham | 0.0 /100 | #345 | Tragic 31.0% |
| Lumbee | 0.0 /100 | #346 | Tragic 31.1% |
| Crow | 0.0 /100 | #347 | Tragic 33.2% |
Demographics Similar to Immigrants from Armenia by Female Poverty Among 18-24 Year Olds
In terms of female poverty among 18-24 year olds, the demographic groups most similar to Immigrants from Armenia are Burmese (18.9%, a difference of 0.030%), Immigrants from Iraq (18.9%, a difference of 0.070%), Immigrants from Jamaica (18.9%, a difference of 0.090%), Croatian (19.0%, a difference of 0.24%), and Immigrants from Cabo Verde (19.0%, a difference of 0.26%).
| Demographics | Rating | Rank | Female Poverty Among 18-24 Year Olds |
| Immigrants | Europe | 99.5 /100 | #78 | Exceptional 18.8% |
| Uruguayans | 99.5 /100 | #79 | Exceptional 18.8% |
| Palestinians | 99.5 /100 | #80 | Exceptional 18.8% |
| Japanese | 99.5 /100 | #81 | Exceptional 18.8% |
| Immigrants | Uruguay | 99.4 /100 | #82 | Exceptional 18.8% |
| Immigrants | Indonesia | 99.4 /100 | #83 | Exceptional 18.9% |
| Burmese | 99.2 /100 | #84 | Exceptional 18.9% |
| Immigrants | Armenia | 99.2 /100 | #85 | Exceptional 18.9% |
| Immigrants | Iraq | 99.2 /100 | #86 | Exceptional 18.9% |
| Immigrants | Jamaica | 99.2 /100 | #87 | Exceptional 18.9% |
| Croatians | 99.1 /100 | #88 | Exceptional 19.0% |
| Immigrants | Cabo Verde | 99.0 /100 | #89 | Exceptional 19.0% |
| Afghans | 99.0 /100 | #90 | Exceptional 19.0% |
| Romanians | 98.9 /100 | #91 | Exceptional 19.0% |
| Filipinos | 98.9 /100 | #92 | Exceptional 19.0% |