Immigrants from Sri Lanka vs Slavic Child Poverty Under the Age of 16
COMPARE
Immigrants from Sri Lanka
Slavic
Child Poverty Under the Age of 16
Child Poverty Under the Age of 16 Comparison
Immigrants from Sri Lanka
Slavs
13.8%
CHILD POVERTY UNDER THE AGE OF 16
99.3/ 100
METRIC RATING
42nd/ 347
METRIC RANK
15.4%
CHILD POVERTY UNDER THE AGE OF 16
84.2/ 100
METRIC RATING
141st/ 347
METRIC RANK
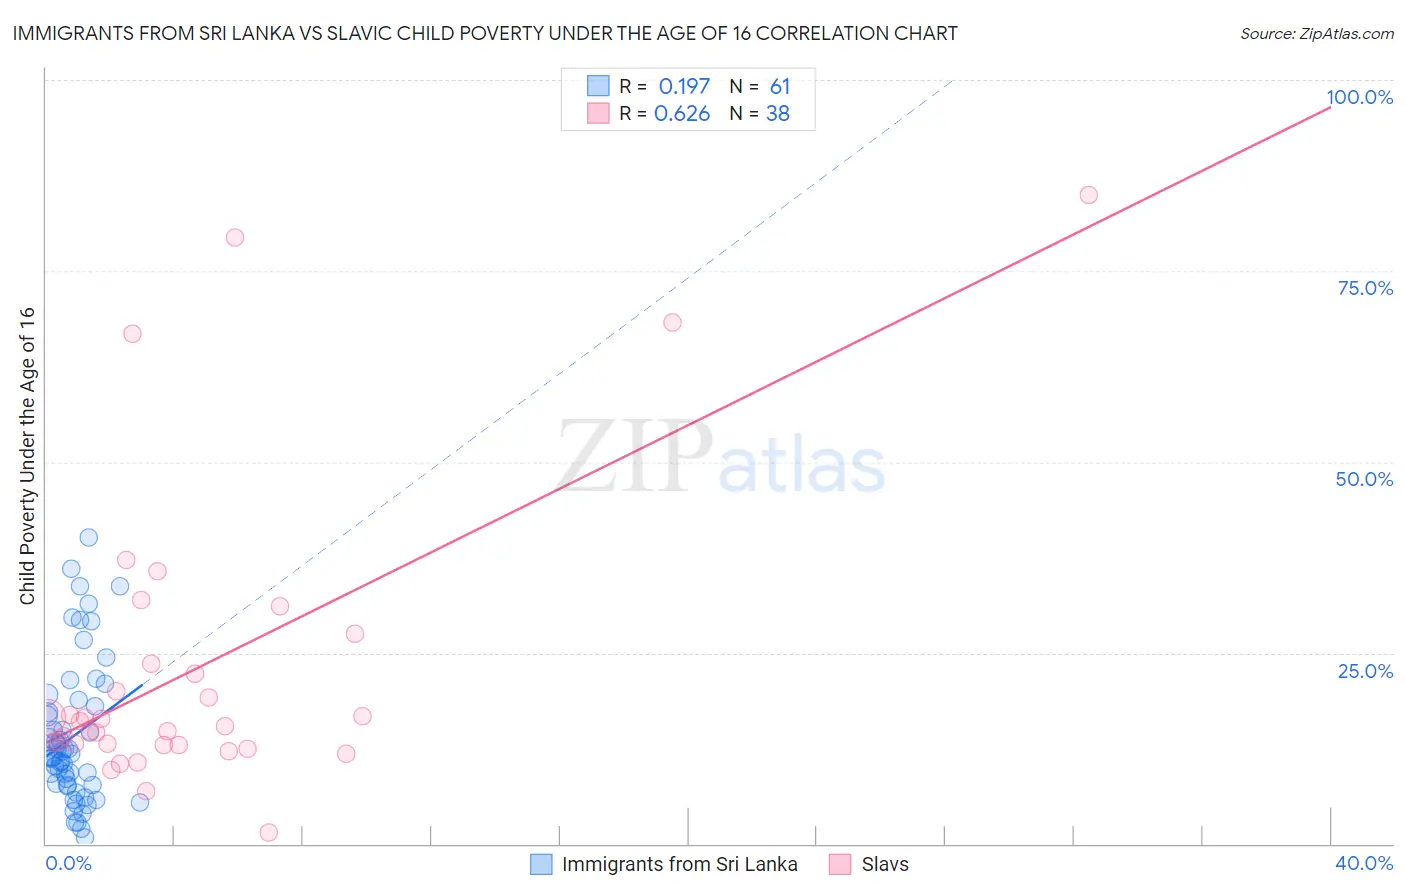
Immigrants from Sri Lanka vs Slavic Child Poverty Under the Age of 16 Correlation Chart
The statistical analysis conducted on geographies consisting of 149,197,772 people shows a poor positive correlation between the proportion of Immigrants from Sri Lanka and poverty level among children under the age of 16 in the United States with a correlation coefficient (R) of 0.197 and weighted average of 13.8%. Similarly, the statistical analysis conducted on geographies consisting of 268,968,300 people shows a significant positive correlation between the proportion of Slavs and poverty level among children under the age of 16 in the United States with a correlation coefficient (R) of 0.626 and weighted average of 15.4%, a difference of 11.8%.
Child Poverty Under the Age of 16 Correlation Summary
| Measurement | Immigrants from Sri Lanka | Slavic |
| Minimum | 0.87% | 1.5% |
| Maximum | 40.1% | 85.0% |
| Range | 39.2% | 83.5% |
| Mean | 14.1% | 23.0% |
| Median | 11.4% | 15.7% |
| Interquartile 25% (IQ1) | 7.6% | 13.0% |
| Interquartile 75% (IQ3) | 18.4% | 23.5% |
| Interquartile Range (IQR) | 10.7% | 10.6% |
| Standard Deviation (Sample) | 9.2% | 19.7% |
| Standard Deviation (Population) | 9.2% | 19.4% |
Similar Demographics by Child Poverty Under the Age of 16
Demographics Similar to Immigrants from Sri Lanka by Child Poverty Under the Age of 16
In terms of child poverty under the age of 16, the demographic groups most similar to Immigrants from Sri Lanka are Immigrants from Moldova (13.8%, a difference of 0.060%), Croatian (13.8%, a difference of 0.080%), Greek (13.8%, a difference of 0.23%), Immigrants from Scotland (13.7%, a difference of 0.24%), and Czech (13.8%, a difference of 0.29%).
| Demographics | Rating | Rank | Child Poverty Under the Age of 16 |
| Lithuanians | 99.6 /100 | #35 | Exceptional 13.5% |
| Immigrants | Northern Europe | 99.6 /100 | #36 | Exceptional 13.6% |
| Immigrants | Bolivia | 99.6 /100 | #37 | Exceptional 13.6% |
| Luxembourgers | 99.5 /100 | #38 | Exceptional 13.6% |
| Immigrants | Australia | 99.5 /100 | #39 | Exceptional 13.6% |
| Immigrants | Scotland | 99.4 /100 | #40 | Exceptional 13.7% |
| Croatians | 99.4 /100 | #41 | Exceptional 13.8% |
| Immigrants | Sri Lanka | 99.3 /100 | #42 | Exceptional 13.8% |
| Immigrants | Moldova | 99.3 /100 | #43 | Exceptional 13.8% |
| Greeks | 99.3 /100 | #44 | Exceptional 13.8% |
| Czechs | 99.3 /100 | #45 | Exceptional 13.8% |
| Immigrants | Asia | 99.2 /100 | #46 | Exceptional 13.8% |
| Estonians | 99.2 /100 | #47 | Exceptional 13.9% |
| Koreans | 99.2 /100 | #48 | Exceptional 13.9% |
| Italians | 99.2 /100 | #49 | Exceptional 13.9% |
Demographics Similar to Slavs by Child Poverty Under the Age of 16
In terms of child poverty under the age of 16, the demographic groups most similar to Slavs are Brazilian (15.4%, a difference of 0.34%), Icelander (15.4%, a difference of 0.41%), Immigrants from Hungary (15.5%, a difference of 0.53%), Immigrants from Peru (15.5%, a difference of 0.58%), and Slovak (15.5%, a difference of 0.62%).
| Demographics | Rating | Rank | Child Poverty Under the Age of 16 |
| Native Hawaiians | 88.7 /100 | #134 | Excellent 15.2% |
| Albanians | 88.6 /100 | #135 | Excellent 15.2% |
| Immigrants | Spain | 87.3 /100 | #136 | Excellent 15.3% |
| Peruvians | 87.2 /100 | #137 | Excellent 15.3% |
| Welsh | 87.2 /100 | #138 | Excellent 15.3% |
| Immigrants | Vietnam | 87.1 /100 | #139 | Excellent 15.3% |
| New Zealanders | 86.9 /100 | #140 | Excellent 15.3% |
| Slavs | 84.2 /100 | #141 | Excellent 15.4% |
| Brazilians | 82.8 /100 | #142 | Excellent 15.4% |
| Icelanders | 82.5 /100 | #143 | Excellent 15.4% |
| Immigrants | Hungary | 81.9 /100 | #144 | Excellent 15.5% |
| Immigrants | Peru | 81.7 /100 | #145 | Excellent 15.5% |
| Slovaks | 81.4 /100 | #146 | Excellent 15.5% |
| Immigrants | Kuwait | 80.5 /100 | #147 | Excellent 15.5% |
| Puget Sound Salish | 80.3 /100 | #148 | Excellent 15.5% |