Kenyan vs Immigrants from Uzbekistan Unemployment Among Ages 60 to 64 years
COMPARE
Kenyan
Immigrants from Uzbekistan
Unemployment Among Ages 60 to 64 years
Unemployment Among Ages 60 to 64 years Comparison
Kenyans
Immigrants from Uzbekistan
4.6%
UNEMPLOYMENT AMONG AGES 60 TO 64 YEARS
99.9/ 100
METRIC RATING
52nd/ 347
METRIC RANK
5.1%
UNEMPLOYMENT AMONG AGES 60 TO 64 YEARS
0.4/ 100
METRIC RATING
262nd/ 347
METRIC RANK
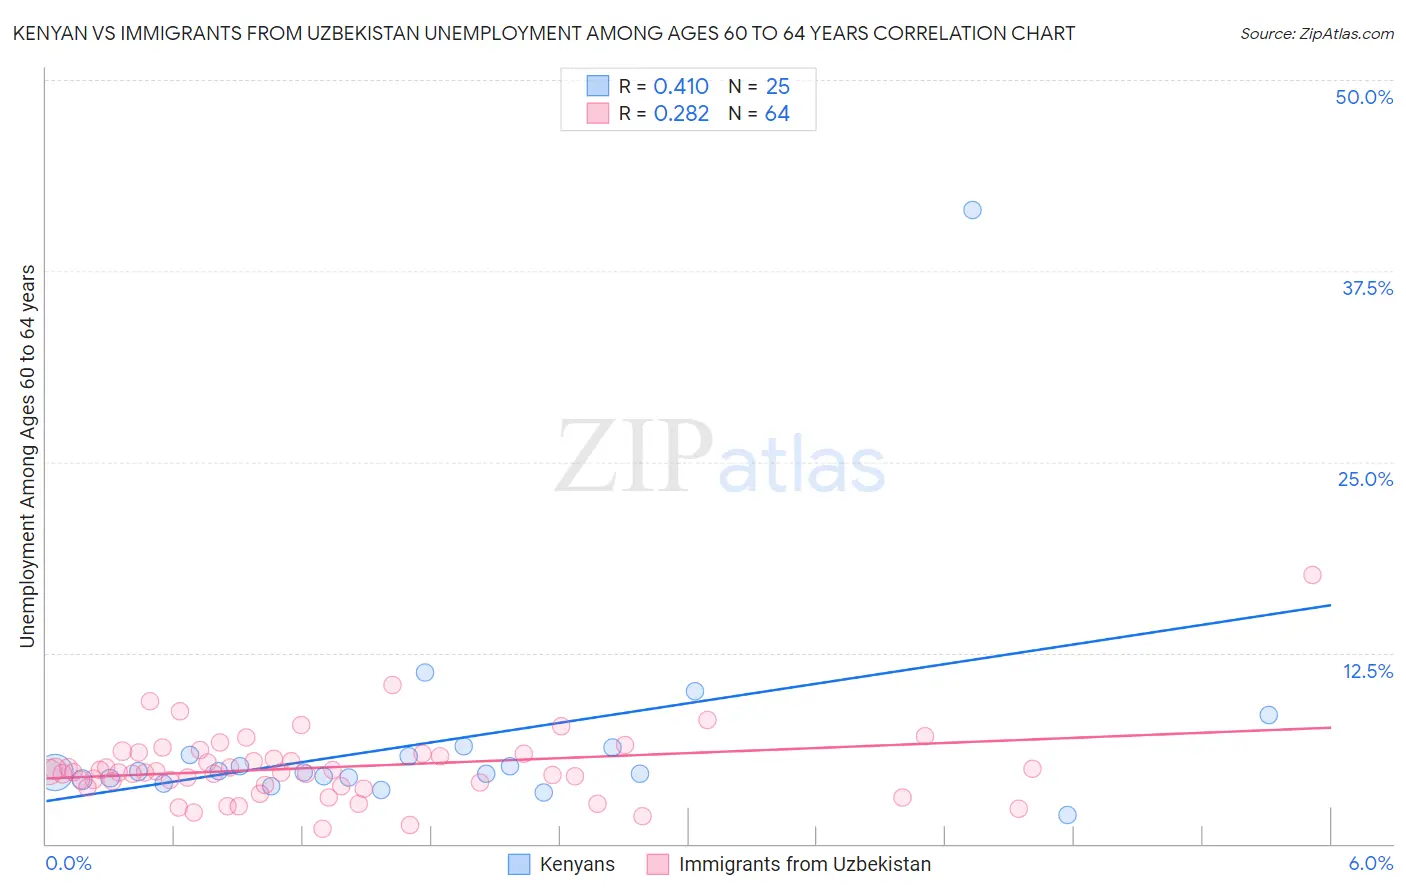
Kenyan vs Immigrants from Uzbekistan Unemployment Among Ages 60 to 64 years Correlation Chart
The statistical analysis conducted on geographies consisting of 160,460,318 people shows a moderate positive correlation between the proportion of Kenyans and unemployment rate among population between the ages 60 and 64 in the United States with a correlation coefficient (R) of 0.410 and weighted average of 4.6%. Similarly, the statistical analysis conducted on geographies consisting of 115,082,688 people shows a weak positive correlation between the proportion of Immigrants from Uzbekistan and unemployment rate among population between the ages 60 and 64 in the United States with a correlation coefficient (R) of 0.282 and weighted average of 5.1%, a difference of 11.6%.
Unemployment Among Ages 60 to 64 years Correlation Summary
| Measurement | Kenyan | Immigrants from Uzbekistan |
| Minimum | 1.9% | 1.0% |
| Maximum | 41.5% | 17.6% |
| Range | 39.6% | 16.6% |
| Mean | 6.7% | 5.0% |
| Median | 4.7% | 4.7% |
| Interquartile 25% (IQ1) | 4.2% | 3.8% |
| Interquartile 75% (IQ3) | 6.1% | 5.9% |
| Interquartile Range (IQR) | 1.8% | 2.1% |
| Standard Deviation (Sample) | 7.5% | 2.4% |
| Standard Deviation (Population) | 7.4% | 2.4% |
Similar Demographics by Unemployment Among Ages 60 to 64 years
Demographics Similar to Kenyans by Unemployment Among Ages 60 to 64 years
In terms of unemployment among ages 60 to 64 years, the demographic groups most similar to Kenyans are Immigrants from Kenya (4.6%, a difference of 0.010%), Immigrants from Moldova (4.6%, a difference of 0.11%), Scottish (4.6%, a difference of 0.12%), Dutch (4.6%, a difference of 0.14%), and Scotch-Irish (4.6%, a difference of 0.16%).
| Demographics | Rating | Rank | Unemployment Among Ages 60 to 64 years |
| Liberians | 99.9 /100 | #45 | Exceptional 4.5% |
| Bhutanese | 99.9 /100 | #46 | Exceptional 4.5% |
| Assyrians/Chaldeans/Syriacs | 99.9 /100 | #47 | Exceptional 4.5% |
| Immigrants | Zimbabwe | 99.9 /100 | #48 | Exceptional 4.6% |
| Scotch-Irish | 99.9 /100 | #49 | Exceptional 4.6% |
| Scottish | 99.9 /100 | #50 | Exceptional 4.6% |
| Immigrants | Kenya | 99.9 /100 | #51 | Exceptional 4.6% |
| Kenyans | 99.9 /100 | #52 | Exceptional 4.6% |
| Immigrants | Moldova | 99.9 /100 | #53 | Exceptional 4.6% |
| Dutch | 99.9 /100 | #54 | Exceptional 4.6% |
| Bangladeshis | 99.9 /100 | #55 | Exceptional 4.6% |
| Welsh | 99.9 /100 | #56 | Exceptional 4.6% |
| British | 99.9 /100 | #57 | Exceptional 4.6% |
| Immigrants | India | 99.8 /100 | #58 | Exceptional 4.6% |
| Swiss | 99.8 /100 | #59 | Exceptional 4.6% |
Demographics Similar to Immigrants from Uzbekistan by Unemployment Among Ages 60 to 64 years
In terms of unemployment among ages 60 to 64 years, the demographic groups most similar to Immigrants from Uzbekistan are Immigrants (5.1%, a difference of 0.010%), Immigrants from Ghana (5.1%, a difference of 0.020%), Sioux (5.1%, a difference of 0.10%), Immigrants from Honduras (5.1%, a difference of 0.12%), and Honduran (5.1%, a difference of 0.25%).
| Demographics | Rating | Rank | Unemployment Among Ages 60 to 64 years |
| Estonians | 0.8 /100 | #255 | Tragic 5.1% |
| Immigrants | Peru | 0.7 /100 | #256 | Tragic 5.1% |
| Japanese | 0.6 /100 | #257 | Tragic 5.1% |
| Celtics | 0.5 /100 | #258 | Tragic 5.1% |
| Hondurans | 0.5 /100 | #259 | Tragic 5.1% |
| Immigrants | Honduras | 0.4 /100 | #260 | Tragic 5.1% |
| Immigrants | Ghana | 0.4 /100 | #261 | Tragic 5.1% |
| Immigrants | Uzbekistan | 0.4 /100 | #262 | Tragic 5.1% |
| Immigrants | Immigrants | 0.4 /100 | #263 | Tragic 5.1% |
| Sioux | 0.3 /100 | #264 | Tragic 5.1% |
| Immigrants | Argentina | 0.2 /100 | #265 | Tragic 5.1% |
| Immigrants | Australia | 0.2 /100 | #266 | Tragic 5.1% |
| Immigrants | Bahamas | 0.2 /100 | #267 | Tragic 5.1% |
| Central American Indians | 0.2 /100 | #268 | Tragic 5.1% |
| Immigrants | Costa Rica | 0.2 /100 | #269 | Tragic 5.1% |