Immigrants from Canada vs Immigrants from Burma/Myanmar Child Poverty Under the Age of 5
COMPARE
Immigrants from Canada
Immigrants from Burma/Myanmar
Child Poverty Under the Age of 5
Child Poverty Under the Age of 5 Comparison
Immigrants from Canada
Immigrants from Burma/Myanmar
15.8%
CHILD POVERTY UNDER THE AGE OF 5
95.9/ 100
METRIC RATING
100th/ 347
METRIC RANK
20.4%
CHILD POVERTY UNDER THE AGE OF 5
0.1/ 100
METRIC RATING
269th/ 347
METRIC RANK
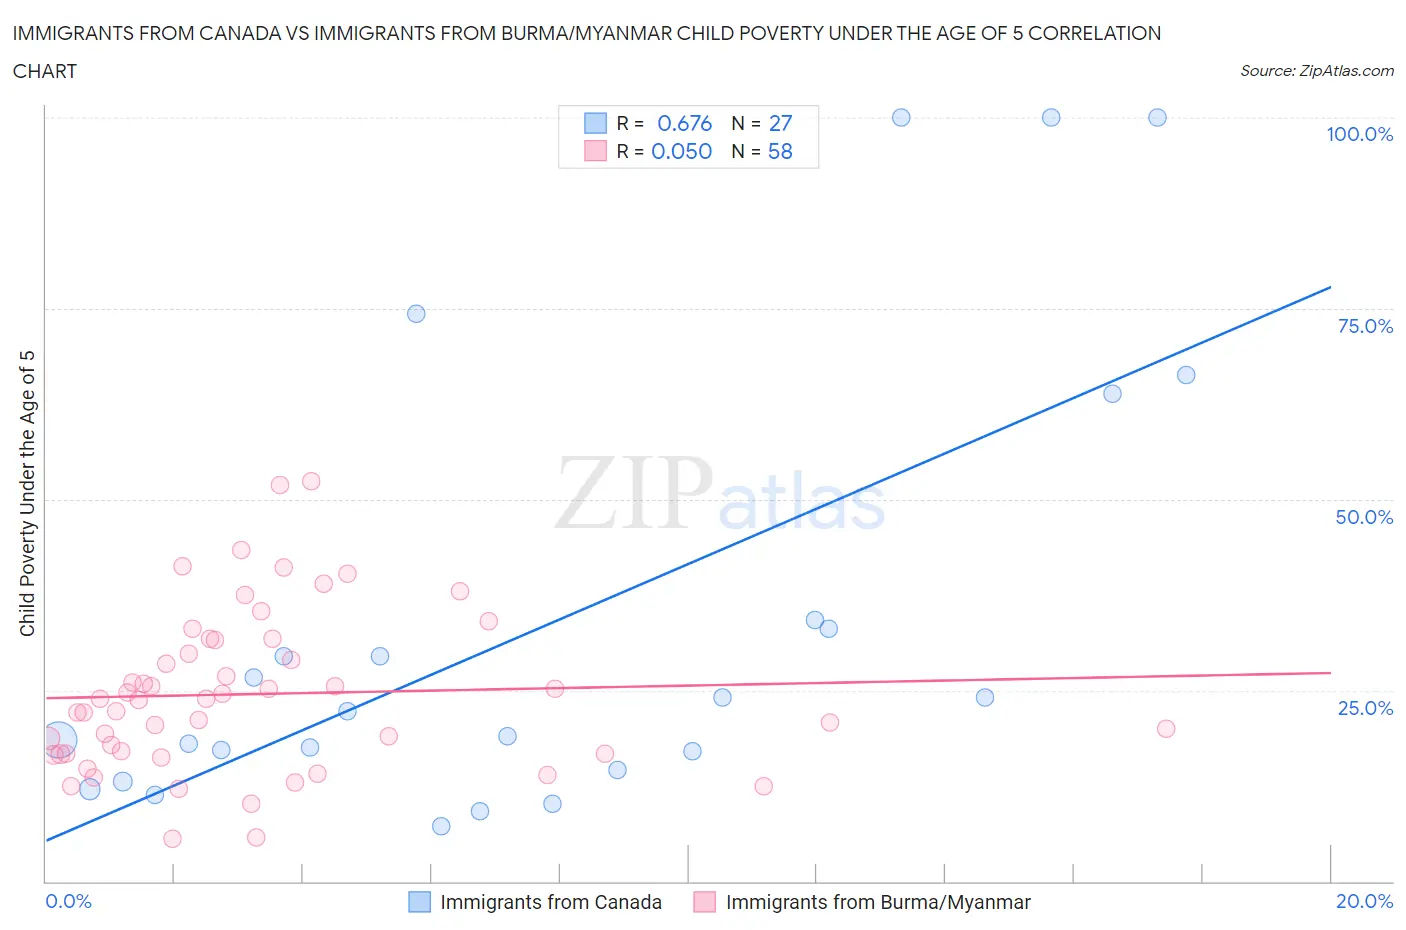
Immigrants from Canada vs Immigrants from Burma/Myanmar Child Poverty Under the Age of 5 Correlation Chart
The statistical analysis conducted on geographies consisting of 434,512,181 people shows a significant positive correlation between the proportion of Immigrants from Canada and poverty level among children under the age of 5 in the United States with a correlation coefficient (R) of 0.676 and weighted average of 15.8%. Similarly, the statistical analysis conducted on geographies consisting of 169,386,512 people shows a slight positive correlation between the proportion of Immigrants from Burma/Myanmar and poverty level among children under the age of 5 in the United States with a correlation coefficient (R) of 0.050 and weighted average of 20.4%, a difference of 28.6%.
Child Poverty Under the Age of 5 Correlation Summary
| Measurement | Immigrants from Canada | Immigrants from Burma/Myanmar |
| Minimum | 7.2% | 5.5% |
| Maximum | 100.0% | 52.3% |
| Range | 92.8% | 46.9% |
| Mean | 33.8% | 24.5% |
| Median | 22.3% | 23.8% |
| Interquartile 25% (IQ1) | 14.6% | 16.7% |
| Interquartile 75% (IQ3) | 34.1% | 31.6% |
| Interquartile Range (IQR) | 19.5% | 15.0% |
| Standard Deviation (Sample) | 29.3% | 10.5% |
| Standard Deviation (Population) | 28.8% | 10.4% |
Similar Demographics by Child Poverty Under the Age of 5
Demographics Similar to Immigrants from Canada by Child Poverty Under the Age of 5
In terms of child poverty under the age of 5, the demographic groups most similar to Immigrants from Canada are Palestinian (15.8%, a difference of 0.010%), Immigrants from Zimbabwe (15.8%, a difference of 0.010%), Immigrants from South Africa (15.8%, a difference of 0.13%), Armenian (15.8%, a difference of 0.14%), and Macedonian (15.8%, a difference of 0.20%).
| Demographics | Rating | Rank | Child Poverty Under the Age of 5 |
| Ukrainians | 97.1 /100 | #93 | Exceptional 15.7% |
| Immigrants | South Eastern Asia | 97.1 /100 | #94 | Exceptional 15.7% |
| Immigrants | Switzerland | 96.4 /100 | #95 | Exceptional 15.8% |
| Immigrants | Kazakhstan | 96.2 /100 | #96 | Exceptional 15.8% |
| Macedonians | 96.2 /100 | #97 | Exceptional 15.8% |
| Immigrants | South Africa | 96.1 /100 | #98 | Exceptional 15.8% |
| Palestinians | 95.9 /100 | #99 | Exceptional 15.8% |
| Immigrants | Canada | 95.9 /100 | #100 | Exceptional 15.8% |
| Immigrants | Zimbabwe | 95.9 /100 | #101 | Exceptional 15.8% |
| Armenians | 95.7 /100 | #102 | Exceptional 15.8% |
| Europeans | 95.3 /100 | #103 | Exceptional 15.9% |
| Immigrants | North America | 94.9 /100 | #104 | Exceptional 15.9% |
| Immigrants | Spain | 94.8 /100 | #105 | Exceptional 15.9% |
| Tlingit-Haida | 94.7 /100 | #106 | Exceptional 15.9% |
| Slovenes | 94.4 /100 | #107 | Exceptional 16.0% |
Demographics Similar to Immigrants from Burma/Myanmar by Child Poverty Under the Age of 5
In terms of child poverty under the age of 5, the demographic groups most similar to Immigrants from Burma/Myanmar are Jamaican (20.4%, a difference of 0.070%), Ottawa (20.3%, a difference of 0.090%), Belizean (20.3%, a difference of 0.090%), Aleut (20.3%, a difference of 0.48%), and American (20.5%, a difference of 0.52%).
| Demographics | Rating | Rank | Child Poverty Under the Age of 5 |
| Liberians | 0.1 /100 | #262 | Tragic 20.2% |
| Barbadians | 0.1 /100 | #263 | Tragic 20.2% |
| Immigrants | Liberia | 0.1 /100 | #264 | Tragic 20.2% |
| Spanish American Indians | 0.1 /100 | #265 | Tragic 20.2% |
| Aleuts | 0.1 /100 | #266 | Tragic 20.3% |
| Ottawa | 0.1 /100 | #267 | Tragic 20.3% |
| Belizeans | 0.1 /100 | #268 | Tragic 20.3% |
| Immigrants | Burma/Myanmar | 0.1 /100 | #269 | Tragic 20.4% |
| Jamaicans | 0.1 /100 | #270 | Tragic 20.4% |
| Americans | 0.1 /100 | #271 | Tragic 20.5% |
| Immigrants | Jamaica | 0.1 /100 | #272 | Tragic 20.5% |
| Central Americans | 0.1 /100 | #273 | Tragic 20.6% |
| Immigrants | Belize | 0.1 /100 | #274 | Tragic 20.6% |
| Bangladeshis | 0.1 /100 | #275 | Tragic 20.6% |
| West Indians | 0.0 /100 | #276 | Tragic 20.6% |