Jordanian vs Immigrants from Burma/Myanmar 4th Grade
COMPARE
Jordanian
Immigrants from Burma/Myanmar
4th Grade
4th Grade Comparison
Jordanians
Immigrants from Burma/Myanmar
97.7%
4TH GRADE
81.3/ 100
METRIC RATING
146th/ 347
METRIC RANK
96.3%
4TH GRADE
0.0/ 100
METRIC RATING
310th/ 347
METRIC RANK
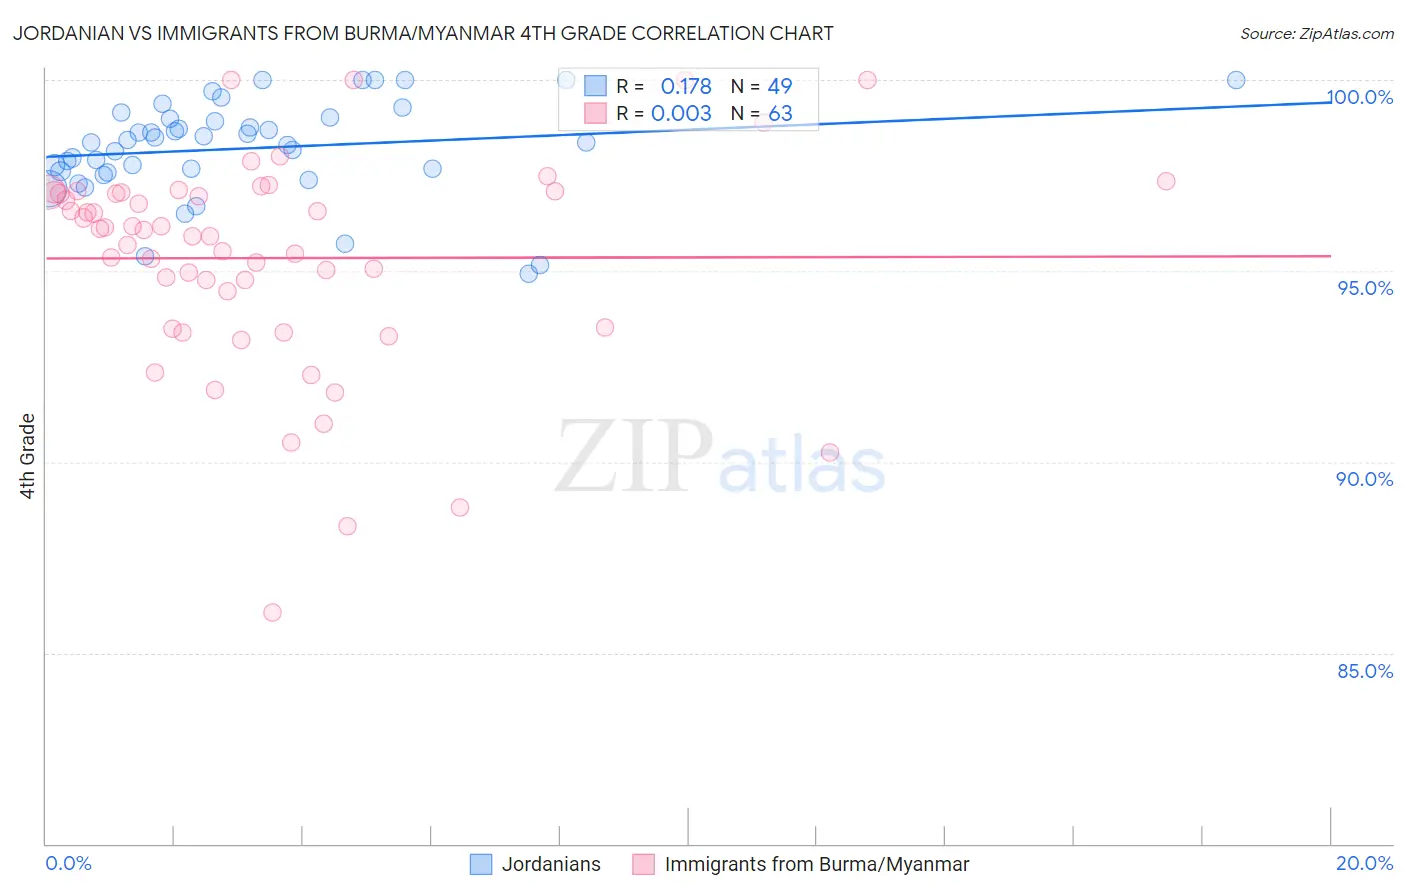
Jordanian vs Immigrants from Burma/Myanmar 4th Grade Correlation Chart
The statistical analysis conducted on geographies consisting of 166,424,117 people shows a poor positive correlation between the proportion of Jordanians and percentage of population with at least 4th grade education in the United States with a correlation coefficient (R) of 0.178 and weighted average of 97.7%. Similarly, the statistical analysis conducted on geographies consisting of 172,338,093 people shows no correlation between the proportion of Immigrants from Burma/Myanmar and percentage of population with at least 4th grade education in the United States with a correlation coefficient (R) of 0.003 and weighted average of 96.3%, a difference of 1.4%.
4th Grade Correlation Summary
| Measurement | Jordanian | Immigrants from Burma/Myanmar |
| Minimum | 94.9% | 86.0% |
| Maximum | 100.0% | 100.0% |
| Range | 5.1% | 14.0% |
| Mean | 98.2% | 95.3% |
| Median | 98.4% | 96.1% |
| Interquartile 25% (IQ1) | 97.6% | 93.5% |
| Interquartile 75% (IQ3) | 99.0% | 97.1% |
| Interquartile Range (IQR) | 1.4% | 3.6% |
| Standard Deviation (Sample) | 1.3% | 2.8% |
| Standard Deviation (Population) | 1.2% | 2.8% |
Similar Demographics by 4th Grade
Demographics Similar to Jordanians by 4th Grade
In terms of 4th grade, the demographic groups most similar to Jordanians are Ute (97.7%, a difference of 0.0%), Hopi (97.7%, a difference of 0.0%), Immigrants from North Macedonia (97.7%, a difference of 0.010%), Burmese (97.7%, a difference of 0.010%), and Spaniard (97.7%, a difference of 0.010%).
| Demographics | Rating | Rank | 4th Grade |
| Seminole | 84.7 /100 | #139 | Excellent 97.7% |
| Filipinos | 84.0 /100 | #140 | Excellent 97.7% |
| Immigrants | Greece | 83.8 /100 | #141 | Excellent 97.7% |
| Immigrants | North Macedonia | 83.3 /100 | #142 | Excellent 97.7% |
| Burmese | 82.8 /100 | #143 | Excellent 97.7% |
| Spaniards | 82.7 /100 | #144 | Excellent 97.7% |
| Immigrants | Moldova | 82.4 /100 | #145 | Excellent 97.7% |
| Jordanians | 81.3 /100 | #146 | Excellent 97.7% |
| Ute | 80.6 /100 | #147 | Excellent 97.7% |
| Hopi | 80.6 /100 | #148 | Excellent 97.7% |
| Soviet Union | 77.8 /100 | #149 | Good 97.6% |
| Immigrants | Israel | 77.7 /100 | #150 | Good 97.6% |
| Alsatians | 77.2 /100 | #151 | Good 97.6% |
| Immigrants | South Central Asia | 76.2 /100 | #152 | Good 97.6% |
| Immigrants | Eastern Europe | 71.3 /100 | #153 | Good 97.6% |
Demographics Similar to Immigrants from Burma/Myanmar by 4th Grade
In terms of 4th grade, the demographic groups most similar to Immigrants from Burma/Myanmar are Immigrants from Guyana (96.3%, a difference of 0.020%), Immigrants from Laos (96.3%, a difference of 0.030%), Immigrants from Haiti (96.3%, a difference of 0.040%), Immigrants from Bangladesh (96.2%, a difference of 0.050%), and Cape Verdean (96.2%, a difference of 0.050%).
| Demographics | Rating | Rank | 4th Grade |
| Guyanese | 0.0 /100 | #303 | Tragic 96.4% |
| Ecuadorians | 0.0 /100 | #304 | Tragic 96.4% |
| Immigrants | Caribbean | 0.0 /100 | #305 | Tragic 96.4% |
| Sri Lankans | 0.0 /100 | #306 | Tragic 96.4% |
| Immigrants | Haiti | 0.0 /100 | #307 | Tragic 96.3% |
| Immigrants | Laos | 0.0 /100 | #308 | Tragic 96.3% |
| Immigrants | Guyana | 0.0 /100 | #309 | Tragic 96.3% |
| Immigrants | Burma/Myanmar | 0.0 /100 | #310 | Tragic 96.3% |
| Immigrants | Bangladesh | 0.0 /100 | #311 | Tragic 96.2% |
| Cape Verdeans | 0.0 /100 | #312 | Tragic 96.2% |
| Indonesians | 0.0 /100 | #313 | Tragic 96.2% |
| Vietnamese | 0.0 /100 | #314 | Tragic 96.2% |
| Nicaraguans | 0.0 /100 | #315 | Tragic 96.2% |
| Immigrants | Ecuador | 0.0 /100 | #316 | Tragic 96.2% |
| Central American Indians | 0.0 /100 | #317 | Tragic 96.2% |