Welsh vs Immigrants from Armenia Single Mother Poverty
COMPARE
Welsh
Immigrants from Armenia
Single Mother Poverty
Single Mother Poverty Comparison
Welsh
Immigrants from Armenia
30.4%
SINGLE MOTHER POVERTY
3.2/ 100
METRIC RATING
236th/ 347
METRIC RANK
28.1%
SINGLE MOTHER POVERTY
95.2/ 100
METRIC RATING
109th/ 347
METRIC RANK
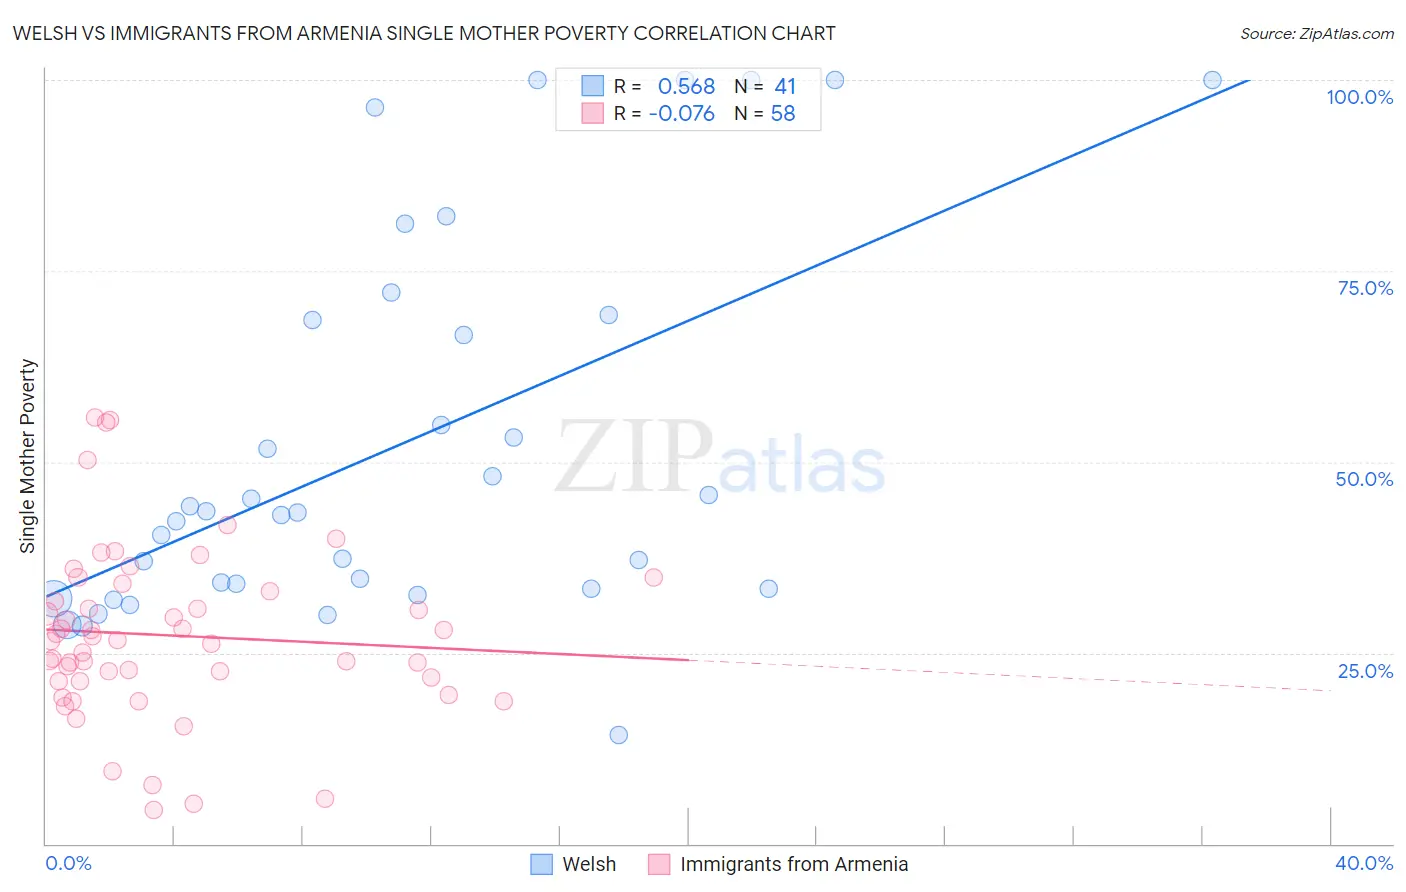
Welsh vs Immigrants from Armenia Single Mother Poverty Correlation Chart
The statistical analysis conducted on geographies consisting of 506,398,542 people shows a substantial positive correlation between the proportion of Welsh and poverty level among single mothers in the United States with a correlation coefficient (R) of 0.568 and weighted average of 30.4%. Similarly, the statistical analysis conducted on geographies consisting of 96,611,895 people shows a slight negative correlation between the proportion of Immigrants from Armenia and poverty level among single mothers in the United States with a correlation coefficient (R) of -0.076 and weighted average of 28.1%, a difference of 7.9%.
Single Mother Poverty Correlation Summary
| Measurement | Welsh | Immigrants from Armenia |
| Minimum | 14.3% | 4.5% |
| Maximum | 100.0% | 55.8% |
| Range | 85.7% | 51.3% |
| Mean | 52.0% | 27.3% |
| Median | 43.3% | 26.6% |
| Interquartile 25% (IQ1) | 33.3% | 21.3% |
| Interquartile 75% (IQ3) | 68.9% | 33.0% |
| Interquartile Range (IQR) | 35.6% | 11.7% |
| Standard Deviation (Sample) | 24.7% | 11.2% |
| Standard Deviation (Population) | 24.4% | 11.1% |
Similar Demographics by Single Mother Poverty
Demographics Similar to Welsh by Single Mother Poverty
In terms of single mother poverty, the demographic groups most similar to Welsh are Immigrants from St. Vincent and the Grenadines (30.4%, a difference of 0.050%), Immigrants from Grenada (30.3%, a difference of 0.070%), Immigrants from Middle Africa (30.3%, a difference of 0.10%), Immigrants from Nicaragua (30.3%, a difference of 0.10%), and Slovak (30.4%, a difference of 0.16%).
| Demographics | Rating | Rank | Single Mother Poverty |
| Immigrants | Barbados | 5.0 /100 | #229 | Tragic 30.2% |
| English | 4.8 /100 | #230 | Tragic 30.2% |
| Dutch | 4.3 /100 | #231 | Tragic 30.2% |
| Alaskan Athabascans | 4.1 /100 | #232 | Tragic 30.3% |
| Immigrants | Middle Africa | 3.5 /100 | #233 | Tragic 30.3% |
| Immigrants | Nicaragua | 3.5 /100 | #234 | Tragic 30.3% |
| Immigrants | Grenada | 3.4 /100 | #235 | Tragic 30.3% |
| Welsh | 3.2 /100 | #236 | Tragic 30.4% |
| Immigrants | St. Vincent and the Grenadines | 3.1 /100 | #237 | Tragic 30.4% |
| Slovaks | 2.8 /100 | #238 | Tragic 30.4% |
| Immigrants | Portugal | 2.1 /100 | #239 | Tragic 30.5% |
| Salvadorans | 1.8 /100 | #240 | Tragic 30.6% |
| Immigrants | Laos | 1.8 /100 | #241 | Tragic 30.6% |
| Immigrants | Burma/Myanmar | 1.7 /100 | #242 | Tragic 30.6% |
| Bermudans | 1.6 /100 | #243 | Tragic 30.6% |
Demographics Similar to Immigrants from Armenia by Single Mother Poverty
In terms of single mother poverty, the demographic groups most similar to Immigrants from Armenia are Immigrants from Zimbabwe (28.1%, a difference of 0.090%), Croatian (28.2%, a difference of 0.12%), Immigrants from Venezuela (28.1%, a difference of 0.17%), Venezuelan (28.2%, a difference of 0.17%), and Immigrants from Kazakhstan (28.2%, a difference of 0.19%).
| Demographics | Rating | Rank | Single Mother Poverty |
| Immigrants | Croatia | 96.7 /100 | #102 | Exceptional 28.0% |
| Immigrants | Northern Africa | 96.6 /100 | #103 | Exceptional 28.0% |
| Italians | 96.6 /100 | #104 | Exceptional 28.0% |
| Israelis | 96.5 /100 | #105 | Exceptional 28.0% |
| Ukrainians | 96.4 /100 | #106 | Exceptional 28.0% |
| Immigrants | Venezuela | 95.8 /100 | #107 | Exceptional 28.1% |
| Immigrants | Zimbabwe | 95.5 /100 | #108 | Exceptional 28.1% |
| Immigrants | Armenia | 95.2 /100 | #109 | Exceptional 28.1% |
| Croatians | 94.8 /100 | #110 | Exceptional 28.2% |
| Venezuelans | 94.5 /100 | #111 | Exceptional 28.2% |
| Immigrants | Kazakhstan | 94.5 /100 | #112 | Exceptional 28.2% |
| Immigrants | South Africa | 93.2 /100 | #113 | Exceptional 28.3% |
| Immigrants | Western Asia | 92.7 /100 | #114 | Exceptional 28.3% |
| Immigrants | Kuwait | 92.7 /100 | #115 | Exceptional 28.3% |
| Immigrants | Uganda | 92.5 /100 | #116 | Exceptional 28.3% |