Sri Lankan vs Immigrants from Armenia Single Mother Poverty
COMPARE
Sri Lankan
Immigrants from Armenia
Single Mother Poverty
Single Mother Poverty Comparison
Sri Lankans
Immigrants from Armenia
26.7%
SINGLE MOTHER POVERTY
99.9/ 100
METRIC RATING
39th/ 347
METRIC RANK
28.1%
SINGLE MOTHER POVERTY
95.2/ 100
METRIC RATING
109th/ 347
METRIC RANK
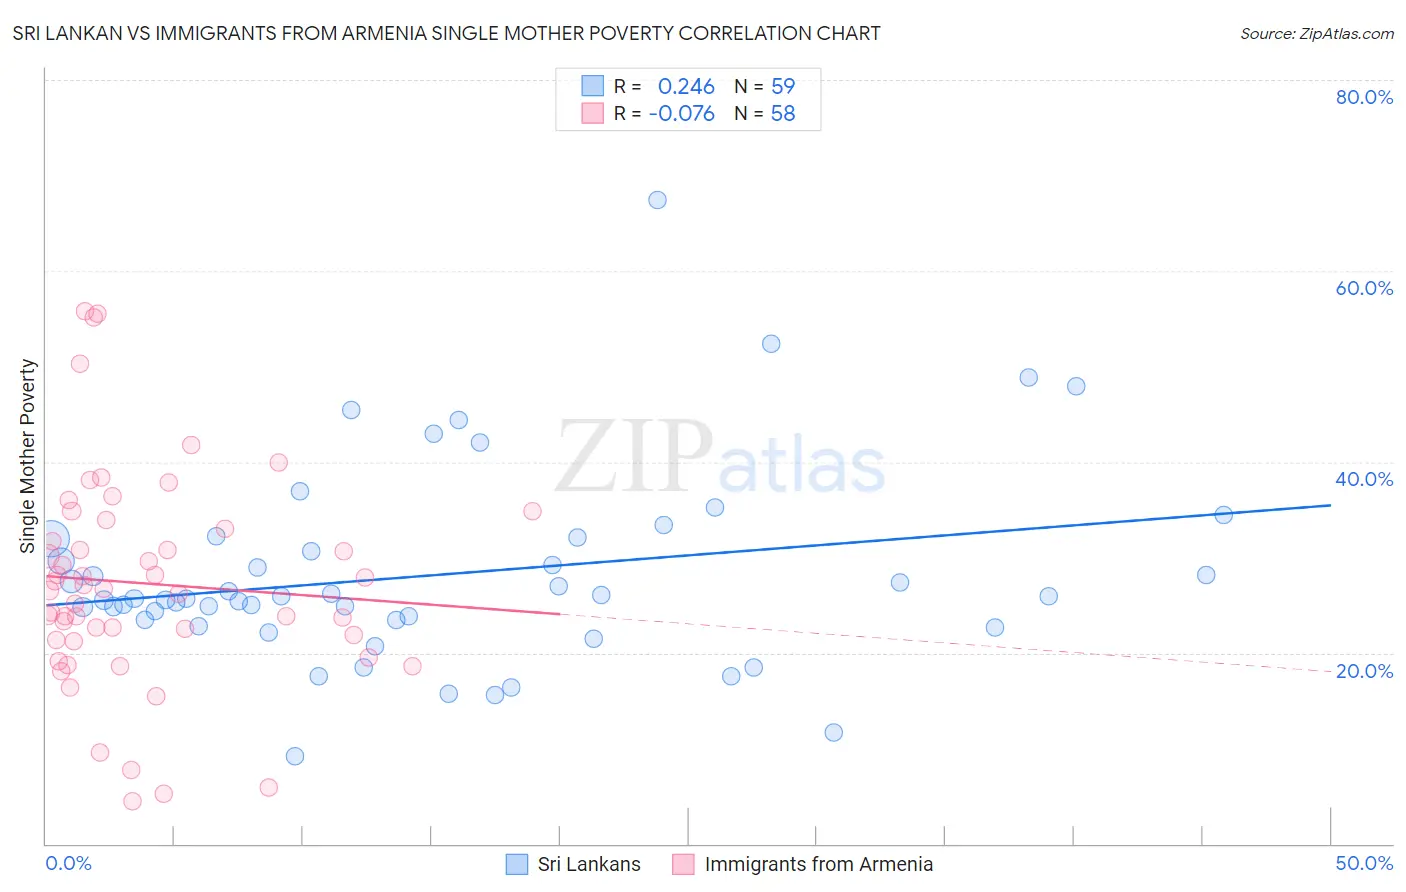
Sri Lankan vs Immigrants from Armenia Single Mother Poverty Correlation Chart
The statistical analysis conducted on geographies consisting of 429,454,799 people shows a weak positive correlation between the proportion of Sri Lankans and poverty level among single mothers in the United States with a correlation coefficient (R) of 0.246 and weighted average of 26.7%. Similarly, the statistical analysis conducted on geographies consisting of 96,611,895 people shows a slight negative correlation between the proportion of Immigrants from Armenia and poverty level among single mothers in the United States with a correlation coefficient (R) of -0.076 and weighted average of 28.1%, a difference of 5.3%.
Single Mother Poverty Correlation Summary
| Measurement | Sri Lankan | Immigrants from Armenia |
| Minimum | 9.1% | 4.5% |
| Maximum | 67.5% | 55.8% |
| Range | 58.4% | 51.3% |
| Mean | 28.2% | 27.3% |
| Median | 25.7% | 26.6% |
| Interquartile 25% (IQ1) | 23.5% | 21.3% |
| Interquartile 75% (IQ3) | 31.9% | 33.0% |
| Interquartile Range (IQR) | 8.4% | 11.7% |
| Standard Deviation (Sample) | 10.2% | 11.2% |
| Standard Deviation (Population) | 10.1% | 11.1% |
Similar Demographics by Single Mother Poverty
Demographics Similar to Sri Lankans by Single Mother Poverty
In terms of single mother poverty, the demographic groups most similar to Sri Lankans are Immigrants from Vietnam (26.7%, a difference of 0.090%), Immigrants from Greece (26.7%, a difference of 0.17%), Immigrants from Fiji (26.6%, a difference of 0.33%), Immigrants from Israel (26.6%, a difference of 0.37%), and Okinawan (26.6%, a difference of 0.38%).
| Demographics | Rating | Rank | Single Mother Poverty |
| Tongans | 99.9 /100 | #32 | Exceptional 26.5% |
| Bulgarians | 99.9 /100 | #33 | Exceptional 26.5% |
| Immigrants | Indonesia | 99.9 /100 | #34 | Exceptional 26.6% |
| Maltese | 99.9 /100 | #35 | Exceptional 26.6% |
| Okinawans | 99.9 /100 | #36 | Exceptional 26.6% |
| Immigrants | Israel | 99.9 /100 | #37 | Exceptional 26.6% |
| Immigrants | Fiji | 99.9 /100 | #38 | Exceptional 26.6% |
| Sri Lankans | 99.9 /100 | #39 | Exceptional 26.7% |
| Immigrants | Vietnam | 99.9 /100 | #40 | Exceptional 26.7% |
| Immigrants | Greece | 99.9 /100 | #41 | Exceptional 26.7% |
| Armenians | 99.9 /100 | #42 | Exceptional 26.8% |
| Tsimshian | 99.9 /100 | #43 | Exceptional 26.8% |
| Immigrants | Sierra Leone | 99.9 /100 | #44 | Exceptional 26.9% |
| Latvians | 99.9 /100 | #45 | Exceptional 26.9% |
| Immigrants | Serbia | 99.9 /100 | #46 | Exceptional 26.9% |
Demographics Similar to Immigrants from Armenia by Single Mother Poverty
In terms of single mother poverty, the demographic groups most similar to Immigrants from Armenia are Immigrants from Zimbabwe (28.1%, a difference of 0.090%), Croatian (28.2%, a difference of 0.12%), Immigrants from Venezuela (28.1%, a difference of 0.17%), Venezuelan (28.2%, a difference of 0.17%), and Immigrants from Kazakhstan (28.2%, a difference of 0.19%).
| Demographics | Rating | Rank | Single Mother Poverty |
| Immigrants | Croatia | 96.7 /100 | #102 | Exceptional 28.0% |
| Immigrants | Northern Africa | 96.6 /100 | #103 | Exceptional 28.0% |
| Italians | 96.6 /100 | #104 | Exceptional 28.0% |
| Israelis | 96.5 /100 | #105 | Exceptional 28.0% |
| Ukrainians | 96.4 /100 | #106 | Exceptional 28.0% |
| Immigrants | Venezuela | 95.8 /100 | #107 | Exceptional 28.1% |
| Immigrants | Zimbabwe | 95.5 /100 | #108 | Exceptional 28.1% |
| Immigrants | Armenia | 95.2 /100 | #109 | Exceptional 28.1% |
| Croatians | 94.8 /100 | #110 | Exceptional 28.2% |
| Venezuelans | 94.5 /100 | #111 | Exceptional 28.2% |
| Immigrants | Kazakhstan | 94.5 /100 | #112 | Exceptional 28.2% |
| Immigrants | South Africa | 93.2 /100 | #113 | Exceptional 28.3% |
| Immigrants | Western Asia | 92.7 /100 | #114 | Exceptional 28.3% |
| Immigrants | Kuwait | 92.7 /100 | #115 | Exceptional 28.3% |
| Immigrants | Uganda | 92.5 /100 | #116 | Exceptional 28.3% |