Japanese vs Immigrants from Lithuania 2nd Grade
COMPARE
Japanese
Immigrants from Lithuania
2nd Grade
2nd Grade Comparison
Japanese
Immigrants from Lithuania
96.5%
2ND GRADE
0.0/ 100
METRIC RATING
329th/ 347
METRIC RANK
98.2%
2ND GRADE
99.3/ 100
METRIC RATING
78th/ 347
METRIC RANK
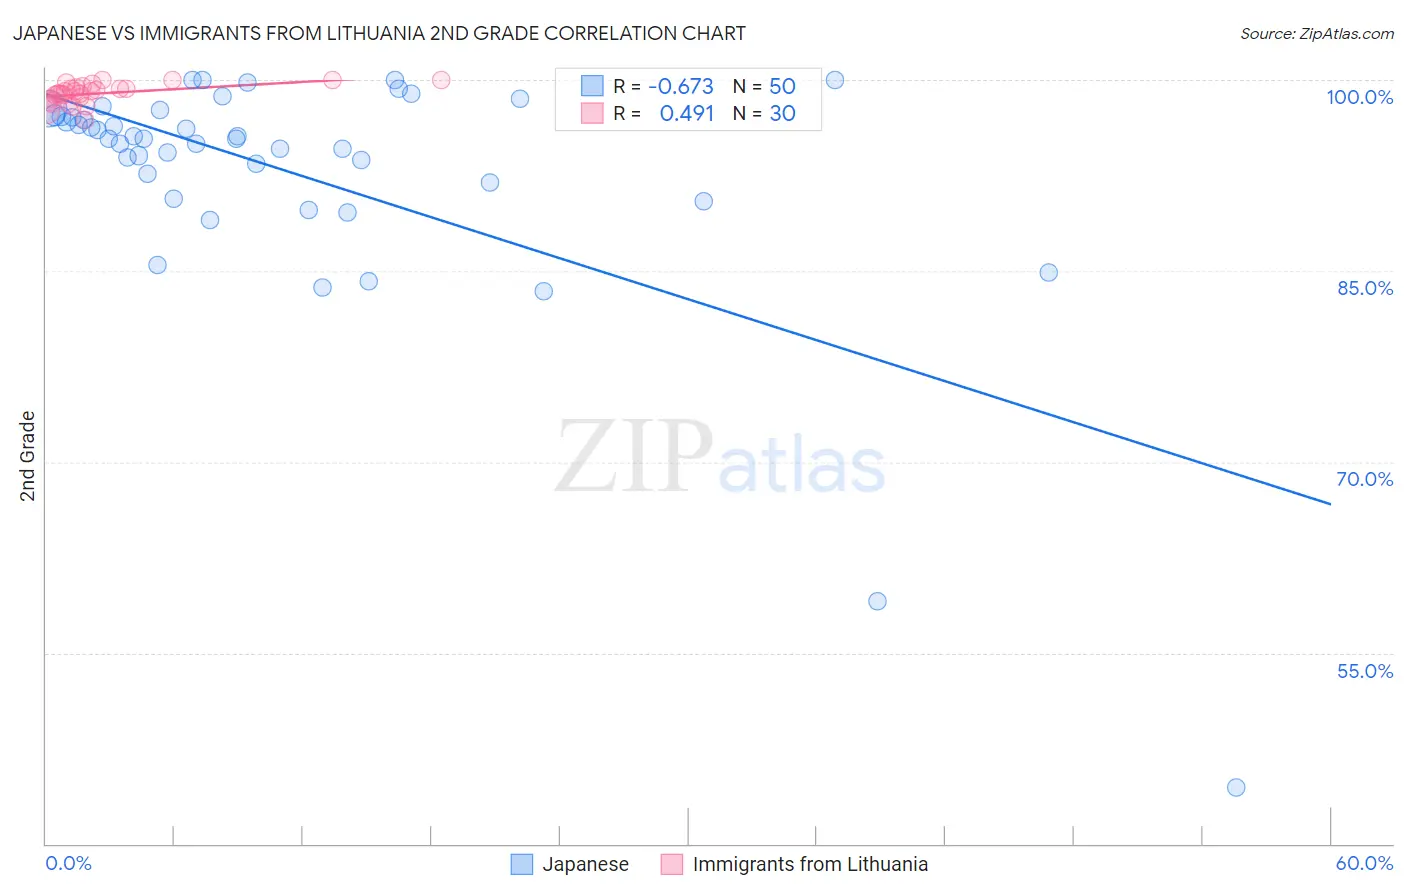
Japanese vs Immigrants from Lithuania 2nd Grade Correlation Chart
The statistical analysis conducted on geographies consisting of 249,183,224 people shows a significant negative correlation between the proportion of Japanese and percentage of population with at least 2nd grade education in the United States with a correlation coefficient (R) of -0.673 and weighted average of 96.5%. Similarly, the statistical analysis conducted on geographies consisting of 117,724,932 people shows a moderate positive correlation between the proportion of Immigrants from Lithuania and percentage of population with at least 2nd grade education in the United States with a correlation coefficient (R) of 0.491 and weighted average of 98.2%, a difference of 1.8%.
2nd Grade Correlation Summary
| Measurement | Japanese | Immigrants from Lithuania |
| Minimum | 44.4% | 96.9% |
| Maximum | 100.0% | 100.0% |
| Range | 55.6% | 3.1% |
| Mean | 92.8% | 98.9% |
| Median | 95.4% | 99.0% |
| Interquartile 25% (IQ1) | 92.0% | 98.6% |
| Interquartile 75% (IQ3) | 97.2% | 99.4% |
| Interquartile Range (IQR) | 5.2% | 0.82% |
| Standard Deviation (Sample) | 9.7% | 0.76% |
| Standard Deviation (Population) | 9.6% | 0.75% |
Similar Demographics by 2nd Grade
Demographics Similar to Japanese by 2nd Grade
In terms of 2nd grade, the demographic groups most similar to Japanese are Mexican (96.5%, a difference of 0.0%), Immigrants from Vietnam (96.5%, a difference of 0.010%), Immigrants from Latin America (96.5%, a difference of 0.010%), Immigrants from Armenia (96.5%, a difference of 0.040%), and Bangladeshi (96.5%, a difference of 0.060%).
| Demographics | Rating | Rank | 2nd Grade |
| Immigrants | Bangladesh | 0.0 /100 | #322 | Tragic 96.7% |
| Vietnamese | 0.0 /100 | #323 | Tragic 96.7% |
| Mexican American Indians | 0.0 /100 | #324 | Tragic 96.7% |
| Dominicans | 0.0 /100 | #325 | Tragic 96.6% |
| Immigrants | Honduras | 0.0 /100 | #326 | Tragic 96.6% |
| Immigrants | Vietnam | 0.0 /100 | #327 | Tragic 96.5% |
| Mexicans | 0.0 /100 | #328 | Tragic 96.5% |
| Japanese | 0.0 /100 | #329 | Tragic 96.5% |
| Immigrants | Latin America | 0.0 /100 | #330 | Tragic 96.5% |
| Immigrants | Armenia | 0.0 /100 | #331 | Tragic 96.5% |
| Bangladeshis | 0.0 /100 | #332 | Tragic 96.5% |
| Immigrants | Dominican Republic | 0.0 /100 | #333 | Tragic 96.4% |
| Central Americans | 0.0 /100 | #334 | Tragic 96.4% |
| Yakama | 0.0 /100 | #335 | Tragic 96.4% |
| Immigrants | Fiji | 0.0 /100 | #336 | Tragic 96.4% |
Demographics Similar to Immigrants from Lithuania by 2nd Grade
In terms of 2nd grade, the demographic groups most similar to Immigrants from Lithuania are Immigrants from Belgium (98.2%, a difference of 0.0%), Osage (98.2%, a difference of 0.0%), Shoshone (98.3%, a difference of 0.010%), Cherokee (98.3%, a difference of 0.010%), and Immigrants from England (98.3%, a difference of 0.010%).
| Demographics | Rating | Rank | 2nd Grade |
| Chickasaw | 99.6 /100 | #71 | Exceptional 98.3% |
| Cheyenne | 99.6 /100 | #72 | Exceptional 98.3% |
| Cajuns | 99.5 /100 | #73 | Exceptional 98.3% |
| Immigrants | Netherlands | 99.4 /100 | #74 | Exceptional 98.3% |
| Shoshone | 99.4 /100 | #75 | Exceptional 98.3% |
| Cherokee | 99.4 /100 | #76 | Exceptional 98.3% |
| Immigrants | England | 99.4 /100 | #77 | Exceptional 98.3% |
| Immigrants | Lithuania | 99.3 /100 | #78 | Exceptional 98.2% |
| Immigrants | Belgium | 99.3 /100 | #79 | Exceptional 98.2% |
| Osage | 99.2 /100 | #80 | Exceptional 98.2% |
| Icelanders | 99.2 /100 | #81 | Exceptional 98.2% |
| Delaware | 99.1 /100 | #82 | Exceptional 98.2% |
| Immigrants | Sweden | 99.1 /100 | #83 | Exceptional 98.2% |
| Hopi | 99.1 /100 | #84 | Exceptional 98.2% |
| Potawatomi | 99.1 /100 | #85 | Exceptional 98.2% |