Italian vs Immigrants from Micronesia Disability Age 18 to 34
COMPARE
Italian
Immigrants from Micronesia
Disability Age 18 to 34
Disability Age 18 to 34 Comparison
Italians
Immigrants from Micronesia
7.1%
DISABILITY AGE 18 TO 34
1.2/ 100
METRIC RATING
239th/ 347
METRIC RANK
7.3%
DISABILITY AGE 18 TO 34
0.3/ 100
METRIC RATING
258th/ 347
METRIC RANK
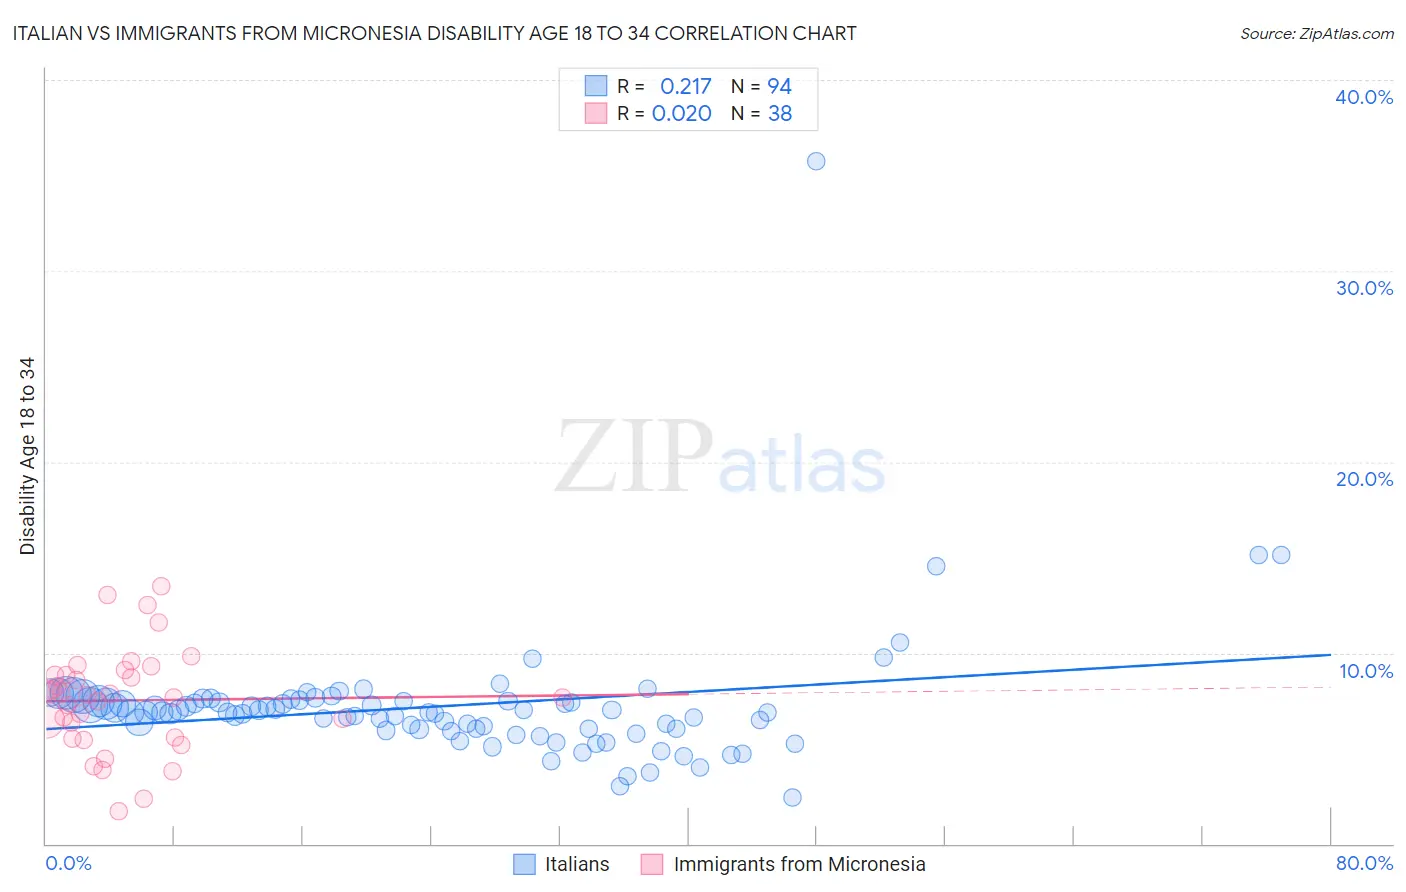
Italian vs Immigrants from Micronesia Disability Age 18 to 34 Correlation Chart
The statistical analysis conducted on geographies consisting of 568,731,898 people shows a weak positive correlation between the proportion of Italians and percentage of population with a disability between the ages 18 and 35 in the United States with a correlation coefficient (R) of 0.217 and weighted average of 7.1%. Similarly, the statistical analysis conducted on geographies consisting of 61,577,951 people shows no correlation between the proportion of Immigrants from Micronesia and percentage of population with a disability between the ages 18 and 35 in the United States with a correlation coefficient (R) of 0.020 and weighted average of 7.3%, a difference of 2.5%.
Disability Age 18 to 34 Correlation Summary
| Measurement | Italian | Immigrants from Micronesia |
| Minimum | 2.5% | 1.7% |
| Maximum | 35.7% | 13.5% |
| Range | 33.3% | 11.8% |
| Mean | 7.2% | 7.5% |
| Median | 6.9% | 7.7% |
| Interquartile 25% (IQ1) | 6.0% | 5.6% |
| Interquartile 75% (IQ3) | 7.5% | 8.8% |
| Interquartile Range (IQR) | 1.5% | 3.3% |
| Standard Deviation (Sample) | 3.6% | 2.7% |
| Standard Deviation (Population) | 3.6% | 2.6% |
Demographics Similar to Italians and Immigrants from Micronesia by Disability Age 18 to 34
In terms of disability age 18 to 34, the demographic groups most similar to Italians are Marshallese (7.1%, a difference of 0.12%), Arapaho (7.1%, a difference of 0.12%), Nepalese (7.1%, a difference of 0.12%), Immigrants from Congo (7.1%, a difference of 0.16%), and Icelander (7.1%, a difference of 0.23%). Similarly, the demographic groups most similar to Immigrants from Micronesia are Czech (7.2%, a difference of 0.44%), Immigrants from Laos (7.2%, a difference of 0.71%), Immigrants from Germany (7.2%, a difference of 0.74%), Indonesian (7.2%, a difference of 0.76%), and Croatian (7.2%, a difference of 1.1%).
| Demographics | Rating | Rank | Disability Age 18 to 34 |
| Marshallese | 1.3 /100 | #238 | Tragic 7.1% |
| Italians | 1.2 /100 | #239 | Tragic 7.1% |
| Arapaho | 1.1 /100 | #240 | Tragic 7.1% |
| Nepalese | 1.1 /100 | #241 | Tragic 7.1% |
| Immigrants | Congo | 1.1 /100 | #242 | Tragic 7.1% |
| Icelanders | 1.0 /100 | #243 | Tragic 7.1% |
| Immigrants | Zaire | 0.9 /100 | #244 | Tragic 7.1% |
| Hungarians | 0.9 /100 | #245 | Tragic 7.1% |
| Immigrants | Liberia | 0.8 /100 | #246 | Tragic 7.1% |
| Yugoslavians | 0.8 /100 | #247 | Tragic 7.2% |
| Guamanians/Chamorros | 0.8 /100 | #248 | Tragic 7.2% |
| Malaysians | 0.7 /100 | #249 | Tragic 7.2% |
| Fijians | 0.6 /100 | #250 | Tragic 7.2% |
| Spaniards | 0.6 /100 | #251 | Tragic 7.2% |
| Poles | 0.6 /100 | #252 | Tragic 7.2% |
| Croatians | 0.5 /100 | #253 | Tragic 7.2% |
| Indonesians | 0.4 /100 | #254 | Tragic 7.2% |
| Immigrants | Germany | 0.4 /100 | #255 | Tragic 7.2% |
| Immigrants | Laos | 0.4 /100 | #256 | Tragic 7.2% |
| Czechs | 0.3 /100 | #257 | Tragic 7.2% |
| Immigrants | Micronesia | 0.3 /100 | #258 | Tragic 7.3% |