Slovak vs Finnish Seniors Poverty Over the Age of 75
COMPARE
Slovak
Finnish
Seniors Poverty Over the Age of 75
Seniors Poverty Over the Age of 75 Comparison
Slovaks
Finns
10.5%
SENIORS POVERTY OVER THE AGE OF 75
99.9/ 100
METRIC RATING
17th/ 347
METRIC RANK
10.8%
SENIORS POVERTY OVER THE AGE OF 75
99.6/ 100
METRIC RATING
38th/ 347
METRIC RANK
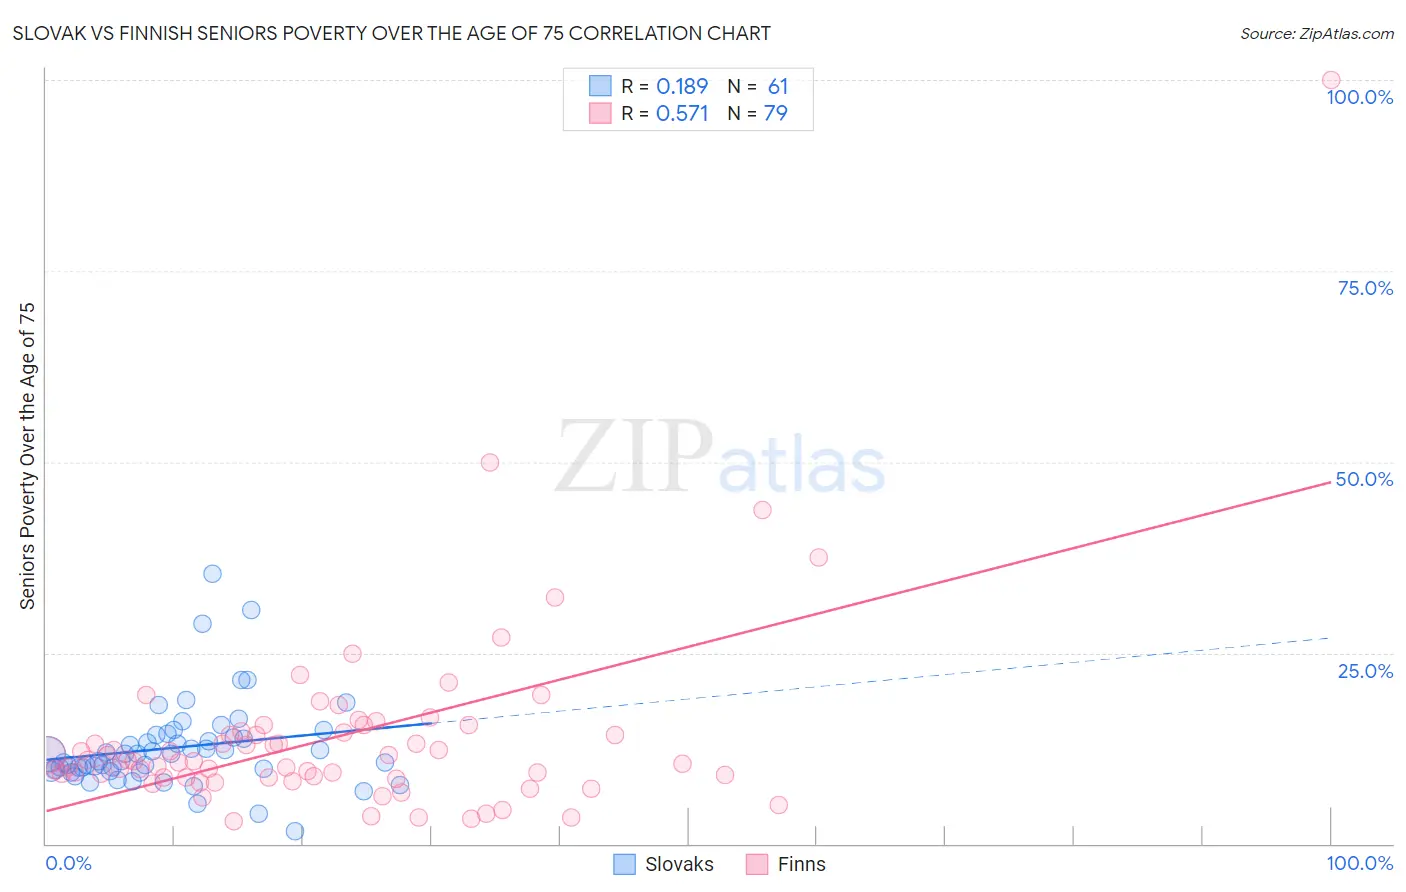
Slovak vs Finnish Seniors Poverty Over the Age of 75 Correlation Chart
The statistical analysis conducted on geographies consisting of 392,230,662 people shows a poor positive correlation between the proportion of Slovaks and poverty level among seniors over the age of 75 in the United States with a correlation coefficient (R) of 0.189 and weighted average of 10.5%. Similarly, the statistical analysis conducted on geographies consisting of 398,908,643 people shows a substantial positive correlation between the proportion of Finns and poverty level among seniors over the age of 75 in the United States with a correlation coefficient (R) of 0.571 and weighted average of 10.8%, a difference of 2.8%.
Seniors Poverty Over the Age of 75 Correlation Summary
| Measurement | Slovak | Finnish |
| Minimum | 1.7% | 2.9% |
| Maximum | 35.3% | 100.0% |
| Range | 33.7% | 97.1% |
| Mean | 12.6% | 13.9% |
| Median | 11.8% | 10.8% |
| Interquartile 25% (IQ1) | 9.6% | 8.6% |
| Interquartile 75% (IQ3) | 14.1% | 14.6% |
| Interquartile Range (IQR) | 4.4% | 6.0% |
| Standard Deviation (Sample) | 5.7% | 12.8% |
| Standard Deviation (Population) | 5.7% | 12.7% |
Similar Demographics by Seniors Poverty Over the Age of 75
Demographics Similar to Slovaks by Seniors Poverty Over the Age of 75
In terms of seniors poverty over the age of 75, the demographic groups most similar to Slovaks are Welsh (10.5%, a difference of 0.010%), Immigrants from Scotland (10.5%, a difference of 0.040%), Czech (10.5%, a difference of 0.060%), Slovene (10.6%, a difference of 0.10%), and Dutch (10.5%, a difference of 0.21%).
| Demographics | Rating | Rank | Seniors Poverty Over the Age of 75 |
| Scandinavians | 99.9 /100 | #10 | Exceptional 10.4% |
| Immigrants | India | 99.9 /100 | #11 | Exceptional 10.4% |
| Tongans | 99.9 /100 | #12 | Exceptional 10.5% |
| Croatians | 99.9 /100 | #13 | Exceptional 10.5% |
| Scottish | 99.9 /100 | #14 | Exceptional 10.5% |
| Europeans | 99.9 /100 | #15 | Exceptional 10.5% |
| Dutch | 99.9 /100 | #16 | Exceptional 10.5% |
| Slovaks | 99.9 /100 | #17 | Exceptional 10.5% |
| Welsh | 99.9 /100 | #18 | Exceptional 10.5% |
| Immigrants | Scotland | 99.9 /100 | #19 | Exceptional 10.5% |
| Czechs | 99.9 /100 | #20 | Exceptional 10.5% |
| Slovenes | 99.9 /100 | #21 | Exceptional 10.6% |
| Bhutanese | 99.8 /100 | #22 | Exceptional 10.6% |
| Lithuanians | 99.8 /100 | #23 | Exceptional 10.6% |
| Poles | 99.8 /100 | #24 | Exceptional 10.6% |
Demographics Similar to Finns by Seniors Poverty Over the Age of 75
In terms of seniors poverty over the age of 75, the demographic groups most similar to Finns are Latvian (10.8%, a difference of 0.14%), Scotch-Irish (10.8%, a difference of 0.30%), Luxembourger (10.8%, a difference of 0.35%), Czechoslovakian (10.9%, a difference of 0.62%), and Italian (10.8%, a difference of 0.74%).
| Demographics | Rating | Rank | Seniors Poverty Over the Age of 75 |
| Marshallese | 99.7 /100 | #31 | Exceptional 10.7% |
| British | 99.7 /100 | #32 | Exceptional 10.7% |
| Puget Sound Salish | 99.7 /100 | #33 | Exceptional 10.8% |
| Italians | 99.7 /100 | #34 | Exceptional 10.8% |
| Luxembourgers | 99.6 /100 | #35 | Exceptional 10.8% |
| Scotch-Irish | 99.6 /100 | #36 | Exceptional 10.8% |
| Latvians | 99.6 /100 | #37 | Exceptional 10.8% |
| Finns | 99.6 /100 | #38 | Exceptional 10.8% |
| Czechoslovakians | 99.4 /100 | #39 | Exceptional 10.9% |
| Thais | 99.4 /100 | #40 | Exceptional 10.9% |
| Immigrants | Lithuania | 99.2 /100 | #41 | Exceptional 11.0% |
| Austrians | 99.1 /100 | #42 | Exceptional 11.0% |
| Celtics | 99.1 /100 | #43 | Exceptional 11.0% |
| Belgians | 99.1 /100 | #44 | Exceptional 11.0% |
| Carpatho Rusyns | 99.0 /100 | #45 | Exceptional 11.1% |