Israeli vs Albanian Seniors Poverty Over the Age of 75
COMPARE
Israeli
Albanian
Seniors Poverty Over the Age of 75
Seniors Poverty Over the Age of 75 Comparison
Israelis
Albanians
13.2%
SENIORS POVERTY OVER THE AGE OF 75
2.0/ 100
METRIC RATING
228th/ 347
METRIC RANK
12.7%
SENIORS POVERTY OVER THE AGE OF 75
9.6/ 100
METRIC RATING
206th/ 347
METRIC RANK
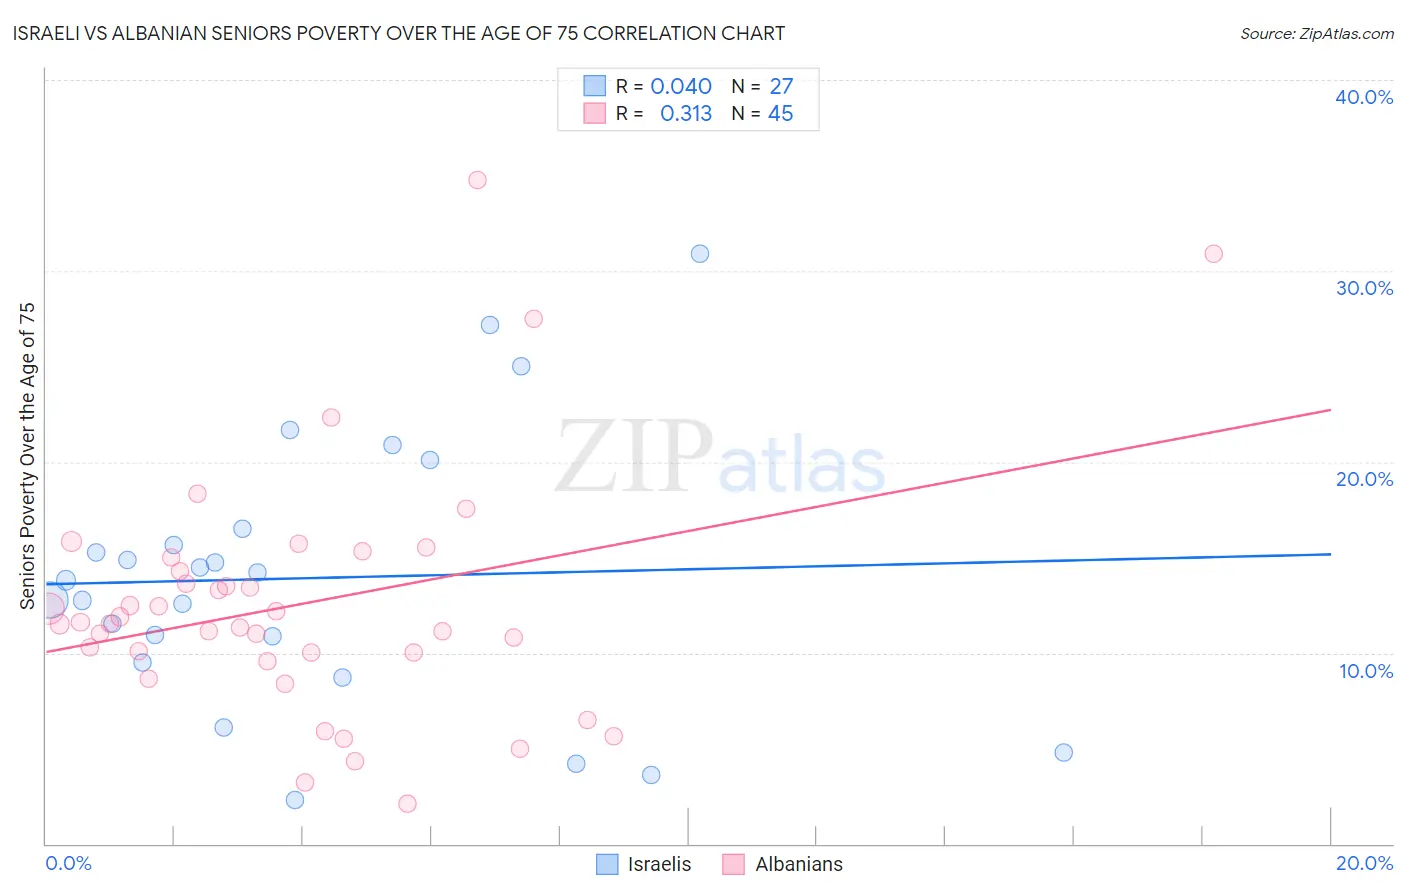
Israeli vs Albanian Seniors Poverty Over the Age of 75 Correlation Chart
The statistical analysis conducted on geographies consisting of 209,472,862 people shows no correlation between the proportion of Israelis and poverty level among seniors over the age of 75 in the United States with a correlation coefficient (R) of 0.040 and weighted average of 13.2%. Similarly, the statistical analysis conducted on geographies consisting of 191,918,637 people shows a mild positive correlation between the proportion of Albanians and poverty level among seniors over the age of 75 in the United States with a correlation coefficient (R) of 0.313 and weighted average of 12.7%, a difference of 3.2%.
Seniors Poverty Over the Age of 75 Correlation Summary
| Measurement | Israeli | Albanian |
| Minimum | 2.3% | 2.1% |
| Maximum | 30.9% | 34.8% |
| Range | 28.6% | 32.7% |
| Mean | 13.9% | 12.5% |
| Median | 13.8% | 11.5% |
| Interquartile 25% (IQ1) | 9.5% | 9.8% |
| Interquartile 75% (IQ3) | 16.5% | 14.6% |
| Interquartile Range (IQR) | 7.0% | 4.9% |
| Standard Deviation (Sample) | 7.1% | 6.5% |
| Standard Deviation (Population) | 6.9% | 6.4% |
Similar Demographics by Seniors Poverty Over the Age of 75
Demographics Similar to Israelis by Seniors Poverty Over the Age of 75
In terms of seniors poverty over the age of 75, the demographic groups most similar to Israelis are Cree (13.1%, a difference of 0.28%), Somali (13.2%, a difference of 0.44%), Immigrants from China (13.2%, a difference of 0.52%), Subsaharan African (13.2%, a difference of 0.53%), and Shoshone (13.1%, a difference of 0.55%).
| Demographics | Rating | Rank | Seniors Poverty Over the Age of 75 |
| Immigrants | Kazakhstan | 4.3 /100 | #221 | Tragic 13.0% |
| Nigerians | 3.4 /100 | #222 | Tragic 13.0% |
| Immigrants | Nigeria | 3.3 /100 | #223 | Tragic 13.0% |
| Chippewa | 2.9 /100 | #224 | Tragic 13.1% |
| Immigrants | Morocco | 2.8 /100 | #225 | Tragic 13.1% |
| Shoshone | 2.6 /100 | #226 | Tragic 13.1% |
| Cree | 2.3 /100 | #227 | Tragic 13.1% |
| Israelis | 2.0 /100 | #228 | Tragic 13.2% |
| Somalis | 1.6 /100 | #229 | Tragic 13.2% |
| Immigrants | China | 1.5 /100 | #230 | Tragic 13.2% |
| Sub-Saharan Africans | 1.5 /100 | #231 | Tragic 13.2% |
| Immigrants | Chile | 1.3 /100 | #232 | Tragic 13.3% |
| Immigrants | Costa Rica | 1.3 /100 | #233 | Tragic 13.3% |
| Immigrants | Israel | 1.1 /100 | #234 | Tragic 13.3% |
| Japanese | 0.9 /100 | #235 | Tragic 13.3% |
Demographics Similar to Albanians by Seniors Poverty Over the Age of 75
In terms of seniors poverty over the age of 75, the demographic groups most similar to Albanians are Indian (Asian) (12.7%, a difference of 0.040%), Immigrants from Eritrea (12.7%, a difference of 0.20%), Costa Rican (12.8%, a difference of 0.20%), Immigrants from Southern Europe (12.7%, a difference of 0.23%), and Immigrants from Eastern Asia (12.8%, a difference of 0.28%).
| Demographics | Rating | Rank | Seniors Poverty Over the Age of 75 |
| Immigrants | Lebanon | 12.7 /100 | #199 | Poor 12.7% |
| Immigrants | Vietnam | 12.1 /100 | #200 | Poor 12.7% |
| Paraguayans | 11.1 /100 | #201 | Poor 12.7% |
| Arapaho | 10.9 /100 | #202 | Poor 12.7% |
| Immigrants | Southern Europe | 10.7 /100 | #203 | Poor 12.7% |
| Immigrants | Eritrea | 10.5 /100 | #204 | Poor 12.7% |
| Indians (Asian) | 9.7 /100 | #205 | Tragic 12.7% |
| Albanians | 9.6 /100 | #206 | Tragic 12.7% |
| Costa Ricans | 8.7 /100 | #207 | Tragic 12.8% |
| Immigrants | Eastern Asia | 8.4 /100 | #208 | Tragic 12.8% |
| Immigrants | Liberia | 7.3 /100 | #209 | Tragic 12.8% |
| Comanche | 7.0 /100 | #210 | Tragic 12.8% |
| Brazilians | 6.9 /100 | #211 | Tragic 12.8% |
| Immigrants | Hong Kong | 6.5 /100 | #212 | Tragic 12.8% |
| French American Indians | 6.1 /100 | #213 | Tragic 12.9% |