Creek vs Czech Female Poverty Among 25-34 Year Olds
COMPARE
Creek
Czech
Female Poverty Among 25-34 Year Olds
Female Poverty Among 25-34 Year Olds Comparison
Creek
Czechs
19.2%
FEMALE POVERTY AMONG 25-34 YEAR OLDS
0.0/ 100
METRIC RATING
329th/ 347
METRIC RANK
12.9%
FEMALE POVERTY AMONG 25-34 YEAR OLDS
90.3/ 100
METRIC RATING
127th/ 347
METRIC RANK
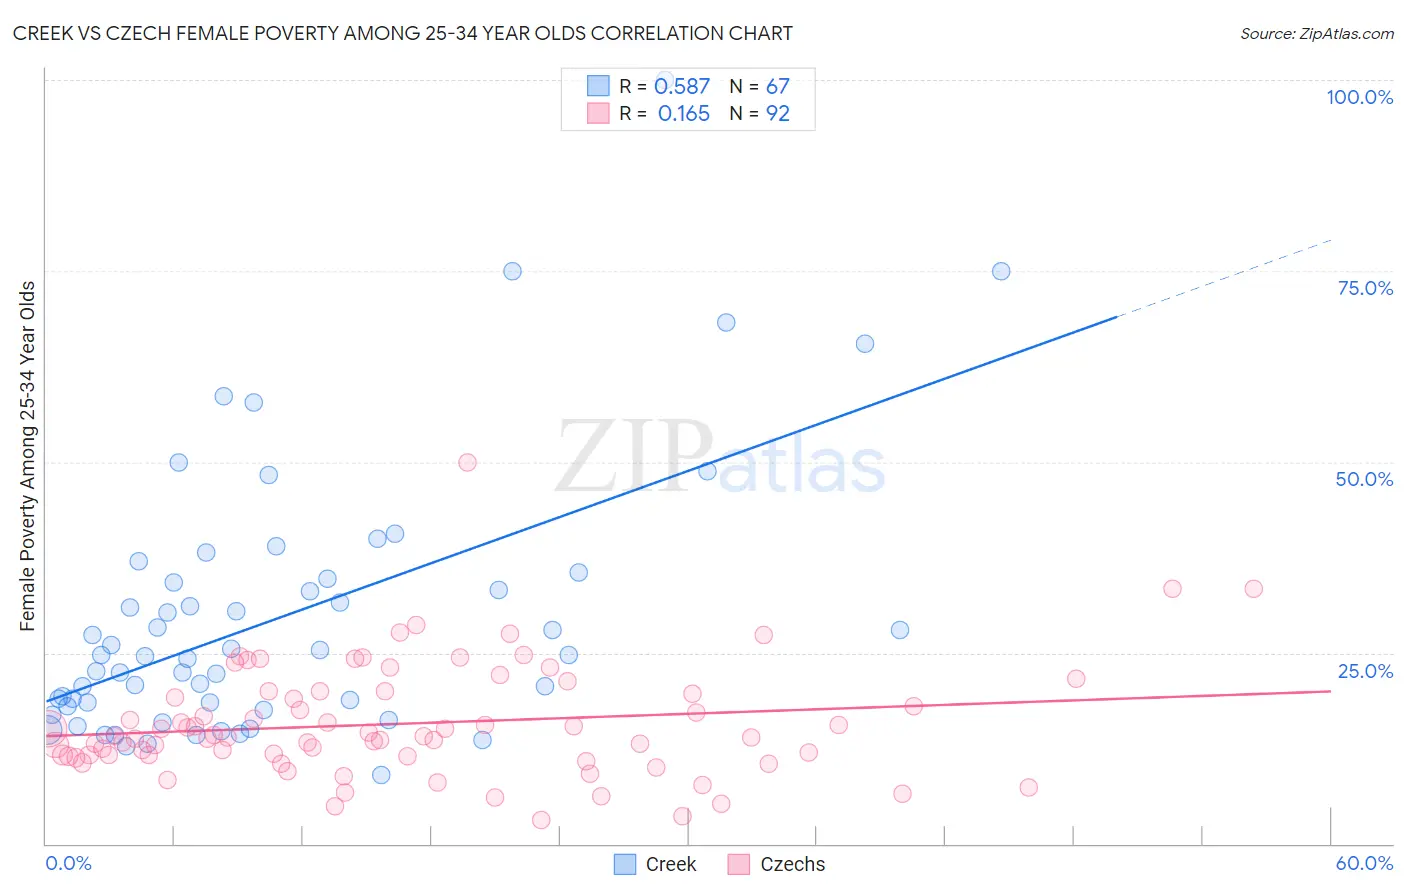
Creek vs Czech Female Poverty Among 25-34 Year Olds Correlation Chart
The statistical analysis conducted on geographies consisting of 177,502,707 people shows a substantial positive correlation between the proportion of Creek and poverty level among females between the ages 25 and 34 in the United States with a correlation coefficient (R) of 0.587 and weighted average of 19.2%. Similarly, the statistical analysis conducted on geographies consisting of 470,997,416 people shows a poor positive correlation between the proportion of Czechs and poverty level among females between the ages 25 and 34 in the United States with a correlation coefficient (R) of 0.165 and weighted average of 12.9%, a difference of 48.4%.
Female Poverty Among 25-34 Year Olds Correlation Summary
| Measurement | Creek | Czech |
| Minimum | 9.0% | 3.0% |
| Maximum | 100.0% | 50.0% |
| Range | 91.0% | 47.0% |
| Mean | 29.7% | 15.7% |
| Median | 24.7% | 14.0% |
| Interquartile 25% (IQ1) | 18.0% | 11.6% |
| Interquartile 75% (IQ3) | 34.7% | 19.8% |
| Interquartile Range (IQR) | 16.8% | 8.3% |
| Standard Deviation (Sample) | 17.6% | 7.4% |
| Standard Deviation (Population) | 17.4% | 7.3% |
Similar Demographics by Female Poverty Among 25-34 Year Olds
Demographics Similar to Creek by Female Poverty Among 25-34 Year Olds
In terms of female poverty among 25-34 year olds, the demographic groups most similar to Creek are Alaskan Athabascan (19.1%, a difference of 0.25%), Cheyenne (19.1%, a difference of 0.33%), Black/African American (18.9%, a difference of 1.3%), Paiute (19.6%, a difference of 2.2%), and Kiowa (19.7%, a difference of 2.7%).
| Demographics | Rating | Rank | Female Poverty Among 25-34 Year Olds |
| Central American Indians | 0.0 /100 | #322 | Tragic 18.2% |
| Seminole | 0.0 /100 | #323 | Tragic 18.3% |
| Dutch West Indians | 0.0 /100 | #324 | Tragic 18.4% |
| Inupiat | 0.0 /100 | #325 | Tragic 18.5% |
| Blacks/African Americans | 0.0 /100 | #326 | Tragic 18.9% |
| Cheyenne | 0.0 /100 | #327 | Tragic 19.1% |
| Alaskan Athabascans | 0.0 /100 | #328 | Tragic 19.1% |
| Creek | 0.0 /100 | #329 | Tragic 19.2% |
| Paiute | 0.0 /100 | #330 | Tragic 19.6% |
| Kiowa | 0.0 /100 | #331 | Tragic 19.7% |
| Immigrants | Yemen | 0.0 /100 | #332 | Tragic 19.8% |
| Cajuns | 0.0 /100 | #333 | Tragic 19.9% |
| Apache | 0.0 /100 | #334 | Tragic 20.1% |
| Natives/Alaskans | 0.0 /100 | #335 | Tragic 20.3% |
| Pueblo | 0.0 /100 | #336 | Tragic 22.2% |
Demographics Similar to Czechs by Female Poverty Among 25-34 Year Olds
In terms of female poverty among 25-34 year olds, the demographic groups most similar to Czechs are Syrian (12.9%, a difference of 0.020%), Immigrants from North America (12.9%, a difference of 0.13%), Immigrants from Uzbekistan (12.9%, a difference of 0.16%), Immigrants from Fiji (12.9%, a difference of 0.23%), and Immigrants from Canada (12.9%, a difference of 0.32%).
| Demographics | Rating | Rank | Female Poverty Among 25-34 Year Olds |
| Carpatho Rusyns | 93.0 /100 | #120 | Exceptional 12.8% |
| Romanians | 92.8 /100 | #121 | Exceptional 12.8% |
| Immigrants | Western Asia | 92.7 /100 | #122 | Exceptional 12.8% |
| Slovenes | 92.7 /100 | #123 | Exceptional 12.8% |
| Immigrants | Netherlands | 92.0 /100 | #124 | Exceptional 12.8% |
| Immigrants | Canada | 91.5 /100 | #125 | Exceptional 12.9% |
| Immigrants | Fiji | 91.2 /100 | #126 | Exceptional 12.9% |
| Czechs | 90.3 /100 | #127 | Exceptional 12.9% |
| Syrians | 90.2 /100 | #128 | Exceptional 12.9% |
| Immigrants | North America | 89.7 /100 | #129 | Excellent 12.9% |
| Immigrants | Uzbekistan | 89.6 /100 | #130 | Excellent 12.9% |
| Pakistanis | 88.4 /100 | #131 | Excellent 13.0% |
| Immigrants | Hungary | 88.3 /100 | #132 | Excellent 13.0% |
| Serbians | 87.6 /100 | #133 | Excellent 13.0% |
| Afghans | 85.8 /100 | #134 | Excellent 13.0% |