Aleut vs Czech Female Poverty Among 25-34 Year Olds
COMPARE
Aleut
Czech
Female Poverty Among 25-34 Year Olds
Female Poverty Among 25-34 Year Olds Comparison
Aleuts
Czechs
16.1%
FEMALE POVERTY AMONG 25-34 YEAR OLDS
0.0/ 100
METRIC RATING
282nd/ 347
METRIC RANK
12.9%
FEMALE POVERTY AMONG 25-34 YEAR OLDS
90.3/ 100
METRIC RATING
127th/ 347
METRIC RANK
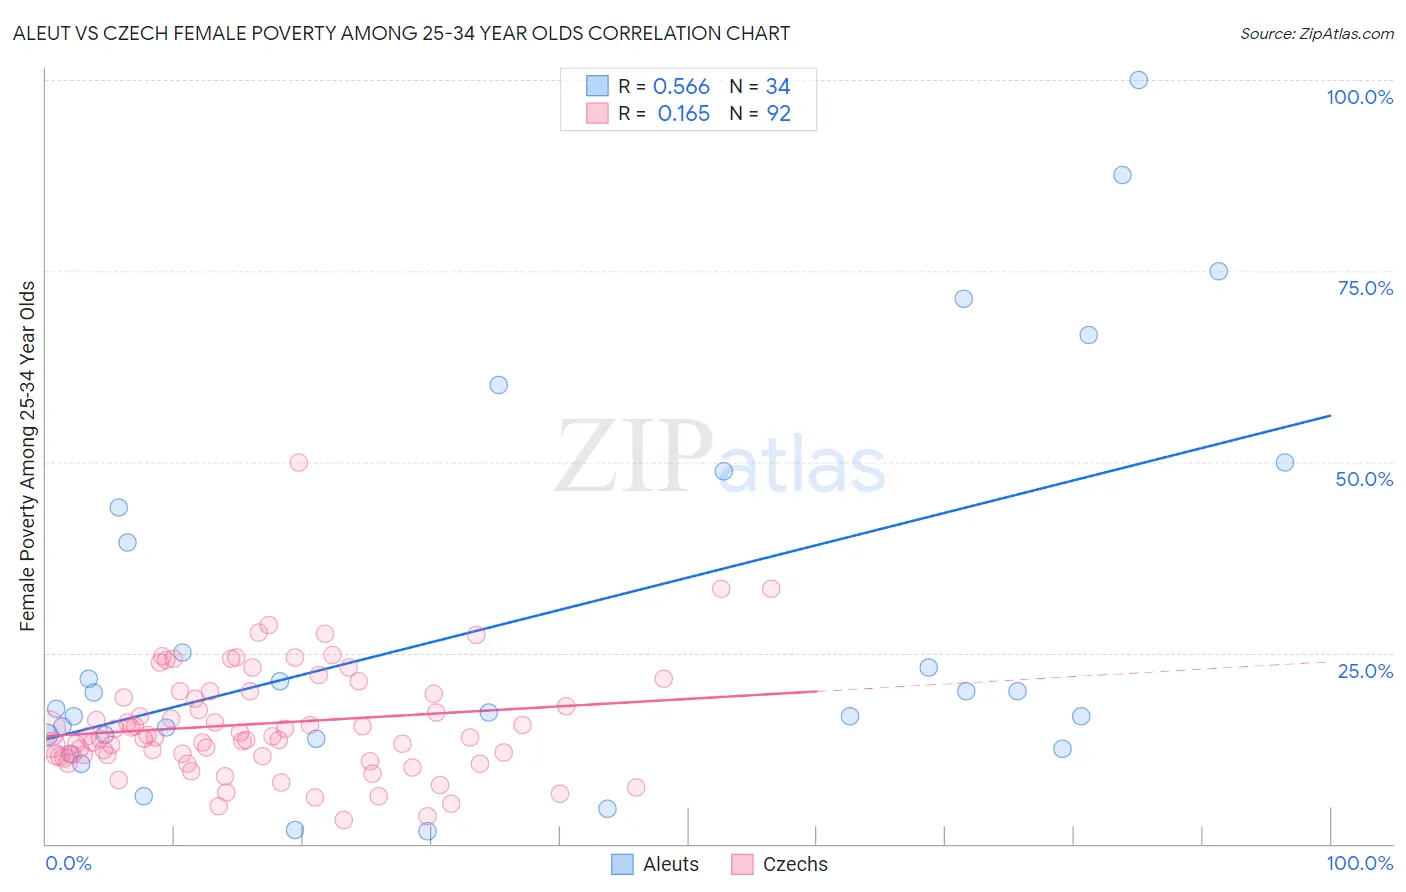
Aleut vs Czech Female Poverty Among 25-34 Year Olds Correlation Chart
The statistical analysis conducted on geographies consisting of 61,505,480 people shows a substantial positive correlation between the proportion of Aleuts and poverty level among females between the ages 25 and 34 in the United States with a correlation coefficient (R) of 0.566 and weighted average of 16.1%. Similarly, the statistical analysis conducted on geographies consisting of 470,997,416 people shows a poor positive correlation between the proportion of Czechs and poverty level among females between the ages 25 and 34 in the United States with a correlation coefficient (R) of 0.165 and weighted average of 12.9%, a difference of 24.7%.
Female Poverty Among 25-34 Year Olds Correlation Summary
| Measurement | Aleut | Czech |
| Minimum | 1.6% | 3.0% |
| Maximum | 100.0% | 50.0% |
| Range | 98.4% | 47.0% |
| Mean | 29.4% | 15.7% |
| Median | 18.7% | 14.0% |
| Interquartile 25% (IQ1) | 14.2% | 11.6% |
| Interquartile 75% (IQ3) | 44.1% | 19.8% |
| Interquartile Range (IQR) | 29.8% | 8.3% |
| Standard Deviation (Sample) | 25.6% | 7.4% |
| Standard Deviation (Population) | 25.2% | 7.3% |
Similar Demographics by Female Poverty Among 25-34 Year Olds
Demographics Similar to Aleuts by Female Poverty Among 25-34 Year Olds
In terms of female poverty among 25-34 year olds, the demographic groups most similar to Aleuts are Bahamian (16.1%, a difference of 0.030%), Immigrants from Latin America (16.0%, a difference of 0.66%), Shoshone (16.2%, a difference of 0.87%), Bangladeshi (15.9%, a difference of 1.2%), and French American Indian (15.9%, a difference of 1.3%).
| Demographics | Rating | Rank | Female Poverty Among 25-34 Year Olds |
| Immigrants | Azores | 0.0 /100 | #275 | Tragic 15.8% |
| Immigrants | Zaire | 0.0 /100 | #276 | Tragic 15.8% |
| Immigrants | Micronesia | 0.0 /100 | #277 | Tragic 15.8% |
| French American Indians | 0.0 /100 | #278 | Tragic 15.9% |
| Fijians | 0.0 /100 | #279 | Tragic 15.9% |
| Bangladeshis | 0.0 /100 | #280 | Tragic 15.9% |
| Immigrants | Latin America | 0.0 /100 | #281 | Tragic 16.0% |
| Aleuts | 0.0 /100 | #282 | Tragic 16.1% |
| Bahamians | 0.0 /100 | #283 | Tragic 16.1% |
| Shoshone | 0.0 /100 | #284 | Tragic 16.2% |
| Immigrants | Bahamas | 0.0 /100 | #285 | Tragic 16.3% |
| Cape Verdeans | 0.0 /100 | #286 | Tragic 16.3% |
| Americans | 0.0 /100 | #287 | Tragic 16.4% |
| Guatemalans | 0.0 /100 | #288 | Tragic 16.4% |
| Osage | 0.0 /100 | #289 | Tragic 16.4% |
Demographics Similar to Czechs by Female Poverty Among 25-34 Year Olds
In terms of female poverty among 25-34 year olds, the demographic groups most similar to Czechs are Syrian (12.9%, a difference of 0.020%), Immigrants from North America (12.9%, a difference of 0.13%), Immigrants from Uzbekistan (12.9%, a difference of 0.16%), Immigrants from Fiji (12.9%, a difference of 0.23%), and Immigrants from Canada (12.9%, a difference of 0.32%).
| Demographics | Rating | Rank | Female Poverty Among 25-34 Year Olds |
| Carpatho Rusyns | 93.0 /100 | #120 | Exceptional 12.8% |
| Romanians | 92.8 /100 | #121 | Exceptional 12.8% |
| Immigrants | Western Asia | 92.7 /100 | #122 | Exceptional 12.8% |
| Slovenes | 92.7 /100 | #123 | Exceptional 12.8% |
| Immigrants | Netherlands | 92.0 /100 | #124 | Exceptional 12.8% |
| Immigrants | Canada | 91.5 /100 | #125 | Exceptional 12.9% |
| Immigrants | Fiji | 91.2 /100 | #126 | Exceptional 12.9% |
| Czechs | 90.3 /100 | #127 | Exceptional 12.9% |
| Syrians | 90.2 /100 | #128 | Exceptional 12.9% |
| Immigrants | North America | 89.7 /100 | #129 | Excellent 12.9% |
| Immigrants | Uzbekistan | 89.6 /100 | #130 | Excellent 12.9% |
| Pakistanis | 88.4 /100 | #131 | Excellent 13.0% |
| Immigrants | Hungary | 88.3 /100 | #132 | Excellent 13.0% |
| Serbians | 87.6 /100 | #133 | Excellent 13.0% |
| Afghans | 85.8 /100 | #134 | Excellent 13.0% |