Irish vs Sioux In Labor Force | Age 25-29
COMPARE
Irish
Sioux
In Labor Force | Age 25-29
In Labor Force | Age 25-29 Comparison
Irish
Sioux
85.0%
IN LABOR FORCE | AGE 25-29
90.6/ 100
METRIC RATING
113th/ 347
METRIC RANK
79.7%
IN LABOR FORCE | AGE 25-29
0.0/ 100
METRIC RATING
333rd/ 347
METRIC RANK
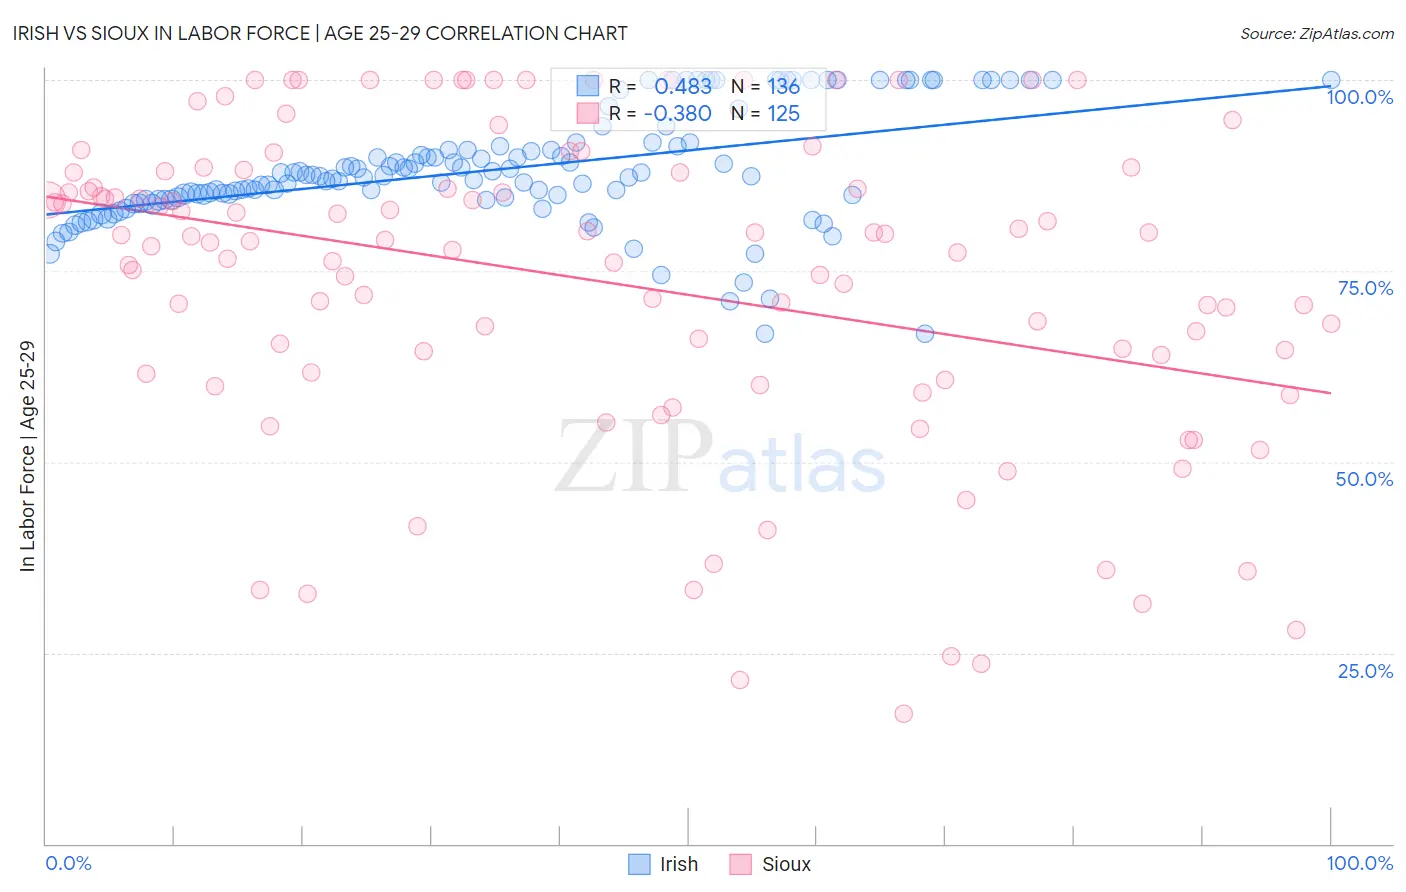
Irish vs Sioux In Labor Force | Age 25-29 Correlation Chart
The statistical analysis conducted on geographies consisting of 578,488,180 people shows a moderate positive correlation between the proportion of Irish and labor force participation rate among population between the ages 25 and 29 in the United States with a correlation coefficient (R) of 0.483 and weighted average of 85.0%. Similarly, the statistical analysis conducted on geographies consisting of 234,111,453 people shows a mild negative correlation between the proportion of Sioux and labor force participation rate among population between the ages 25 and 29 in the United States with a correlation coefficient (R) of -0.380 and weighted average of 79.7%, a difference of 6.7%.
In Labor Force | Age 25-29 Correlation Summary
| Measurement | Irish | Sioux |
| Minimum | 66.7% | 17.0% |
| Maximum | 100.0% | 100.0% |
| Range | 33.3% | 83.0% |
| Mean | 88.2% | 73.7% |
| Median | 87.5% | 78.9% |
| Interquartile 25% (IQ1) | 84.3% | 61.6% |
| Interquartile 75% (IQ3) | 91.3% | 87.9% |
| Interquartile Range (IQR) | 7.0% | 26.3% |
| Standard Deviation (Sample) | 7.4% | 20.5% |
| Standard Deviation (Population) | 7.4% | 20.4% |
Similar Demographics by In Labor Force | Age 25-29
Demographics Similar to Irish by In Labor Force | Age 25-29
In terms of in labor force | age 25-29, the demographic groups most similar to Irish are Senegalese (85.0%, a difference of 0.010%), Immigrants from Malaysia (85.0%, a difference of 0.010%), New Zealander (85.0%, a difference of 0.020%), Immigrants from Middle Africa (85.0%, a difference of 0.020%), and Immigrants from Austria (85.0%, a difference of 0.030%).
| Demographics | Rating | Rank | In Labor Force | Age 25-29 |
| Czechoslovakians | 92.6 /100 | #106 | Exceptional 85.0% |
| Immigrants | Southern Europe | 92.3 /100 | #107 | Exceptional 85.0% |
| Immigrants | Austria | 91.9 /100 | #108 | Exceptional 85.0% |
| Costa Ricans | 91.9 /100 | #109 | Exceptional 85.0% |
| New Zealanders | 91.5 /100 | #110 | Exceptional 85.0% |
| Immigrants | Middle Africa | 91.4 /100 | #111 | Exceptional 85.0% |
| Senegalese | 90.9 /100 | #112 | Exceptional 85.0% |
| Irish | 90.6 /100 | #113 | Exceptional 85.0% |
| Immigrants | Malaysia | 90.4 /100 | #114 | Exceptional 85.0% |
| South Africans | 88.9 /100 | #115 | Excellent 85.0% |
| Chileans | 88.8 /100 | #116 | Excellent 85.0% |
| Immigrants | Belarus | 88.0 /100 | #117 | Excellent 85.0% |
| Finns | 87.8 /100 | #118 | Excellent 85.0% |
| Filipinos | 87.1 /100 | #119 | Excellent 84.9% |
| Immigrants | South Africa | 86.1 /100 | #120 | Excellent 84.9% |
Demographics Similar to Sioux by In Labor Force | Age 25-29
In terms of in labor force | age 25-29, the demographic groups most similar to Sioux are Inupiat (79.8%, a difference of 0.11%), Yuman (79.3%, a difference of 0.42%), Native/Alaskan (79.3%, a difference of 0.50%), Apache (79.2%, a difference of 0.57%), and Cheyenne (80.3%, a difference of 0.80%).
| Demographics | Rating | Rank | In Labor Force | Age 25-29 |
| Choctaw | 0.0 /100 | #326 | Tragic 81.0% |
| Ute | 0.0 /100 | #327 | Tragic 80.8% |
| Creek | 0.0 /100 | #328 | Tragic 80.7% |
| Yakama | 0.0 /100 | #329 | Tragic 80.6% |
| Puerto Ricans | 0.0 /100 | #330 | Tragic 80.4% |
| Cheyenne | 0.0 /100 | #331 | Tragic 80.3% |
| Inupiat | 0.0 /100 | #332 | Tragic 79.8% |
| Sioux | 0.0 /100 | #333 | Tragic 79.7% |
| Yuman | 0.0 /100 | #334 | Tragic 79.3% |
| Natives/Alaskans | 0.0 /100 | #335 | Tragic 79.3% |
| Apache | 0.0 /100 | #336 | Tragic 79.2% |
| Crow | 0.0 /100 | #337 | Tragic 78.6% |
| Lumbee | 0.0 /100 | #338 | Tragic 78.3% |
| Immigrants | Yemen | 0.0 /100 | #339 | Tragic 78.2% |
| Paiute | 0.0 /100 | #340 | Tragic 78.1% |