Irish vs Immigrants from Switzerland High School Diploma
COMPARE
Irish
Immigrants from Switzerland
High School Diploma
High School Diploma Comparison
Irish
Immigrants from Switzerland
91.4%
HIGH SCHOOL DIPLOMA
99.9/ 100
METRIC RATING
35th/ 347
METRIC RANK
90.8%
HIGH SCHOOL DIPLOMA
99.3/ 100
METRIC RATING
81st/ 347
METRIC RANK
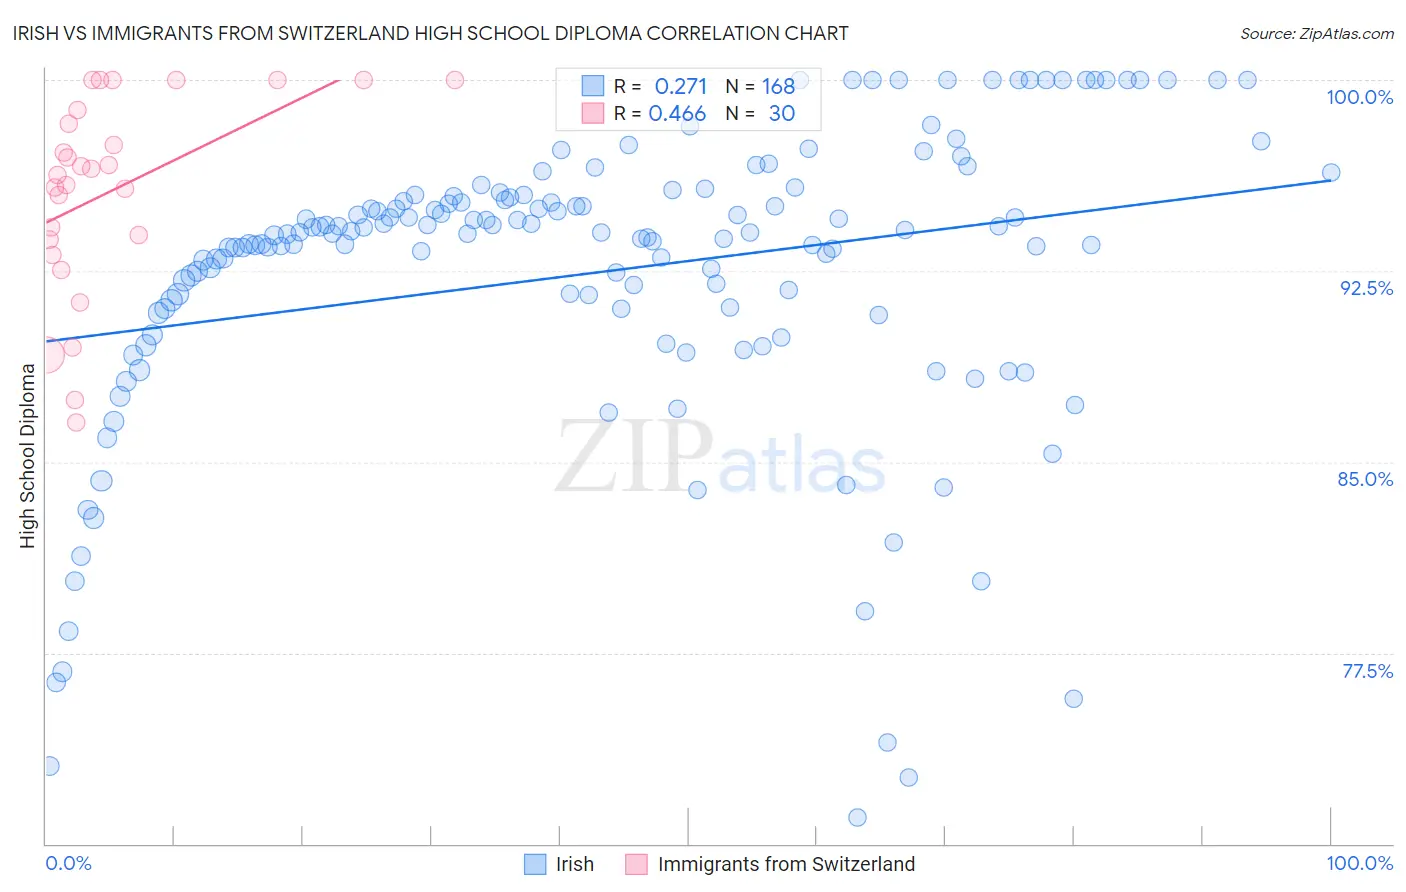
Irish vs Immigrants from Switzerland High School Diploma Correlation Chart
The statistical analysis conducted on geographies consisting of 580,709,825 people shows a weak positive correlation between the proportion of Irish and percentage of population with at least high school diploma education in the United States with a correlation coefficient (R) of 0.271 and weighted average of 91.4%. Similarly, the statistical analysis conducted on geographies consisting of 148,083,583 people shows a moderate positive correlation between the proportion of Immigrants from Switzerland and percentage of population with at least high school diploma education in the United States with a correlation coefficient (R) of 0.466 and weighted average of 90.8%, a difference of 0.63%.
High School Diploma Correlation Summary
| Measurement | Irish | Immigrants from Switzerland |
| Minimum | 71.0% | 86.5% |
| Maximum | 100.0% | 100.0% |
| Range | 29.0% | 13.5% |
| Mean | 92.4% | 95.6% |
| Median | 94.0% | 96.4% |
| Interquartile 25% (IQ1) | 90.9% | 93.7% |
| Interquartile 75% (IQ3) | 95.3% | 98.8% |
| Interquartile Range (IQR) | 4.4% | 5.1% |
| Standard Deviation (Sample) | 5.9% | 3.9% |
| Standard Deviation (Population) | 5.9% | 3.8% |
Similar Demographics by High School Diploma
Demographics Similar to Irish by High School Diploma
In terms of high school diploma, the demographic groups most similar to Irish are Okinawan (91.4%, a difference of 0.030%), Scottish (91.4%, a difference of 0.030%), Tsimshian (91.3%, a difference of 0.030%), Immigrants from Northern Europe (91.4%, a difference of 0.040%), and English (91.4%, a difference of 0.040%).
| Demographics | Rating | Rank | High School Diploma |
| Tlingit-Haida | 99.9 /100 | #28 | Exceptional 91.4% |
| Europeans | 99.9 /100 | #29 | Exceptional 91.4% |
| Iranians | 99.9 /100 | #30 | Exceptional 91.4% |
| Immigrants | Northern Europe | 99.9 /100 | #31 | Exceptional 91.4% |
| English | 99.9 /100 | #32 | Exceptional 91.4% |
| Okinawans | 99.9 /100 | #33 | Exceptional 91.4% |
| Scottish | 99.9 /100 | #34 | Exceptional 91.4% |
| Irish | 99.9 /100 | #35 | Exceptional 91.4% |
| Tsimshian | 99.9 /100 | #36 | Exceptional 91.3% |
| Immigrants | Ireland | 99.9 /100 | #37 | Exceptional 91.3% |
| Immigrants | Scotland | 99.8 /100 | #38 | Exceptional 91.3% |
| Dutch | 99.8 /100 | #39 | Exceptional 91.3% |
| Immigrants | Lithuania | 99.8 /100 | #40 | Exceptional 91.3% |
| Immigrants | Australia | 99.8 /100 | #41 | Exceptional 91.3% |
| Northern Europeans | 99.8 /100 | #42 | Exceptional 91.3% |
Demographics Similar to Immigrants from Switzerland by High School Diploma
In terms of high school diploma, the demographic groups most similar to Immigrants from Switzerland are Immigrants from England (90.8%, a difference of 0.0%), Immigrants from Denmark (90.8%, a difference of 0.010%), Native Hawaiian (90.8%, a difference of 0.020%), Burmese (90.8%, a difference of 0.020%), and Hungarian (90.8%, a difference of 0.030%).
| Demographics | Rating | Rank | High School Diploma |
| Immigrants | Czechoslovakia | 99.4 /100 | #74 | Exceptional 90.9% |
| Cambodians | 99.4 /100 | #75 | Exceptional 90.8% |
| Hungarians | 99.3 /100 | #76 | Exceptional 90.8% |
| Native Hawaiians | 99.3 /100 | #77 | Exceptional 90.8% |
| Burmese | 99.3 /100 | #78 | Exceptional 90.8% |
| Immigrants | Denmark | 99.3 /100 | #79 | Exceptional 90.8% |
| Immigrants | England | 99.3 /100 | #80 | Exceptional 90.8% |
| Immigrants | Switzerland | 99.3 /100 | #81 | Exceptional 90.8% |
| Scotch-Irish | 99.2 /100 | #82 | Exceptional 90.8% |
| Immigrants | Moldova | 99.2 /100 | #83 | Exceptional 90.7% |
| Immigrants | Saudi Arabia | 99.1 /100 | #84 | Exceptional 90.7% |
| Romanians | 98.9 /100 | #85 | Exceptional 90.7% |
| Immigrants | Bulgaria | 98.9 /100 | #86 | Exceptional 90.6% |
| Immigrants | Turkey | 98.9 /100 | #87 | Exceptional 90.6% |
| Immigrants | France | 98.8 /100 | #88 | Exceptional 90.6% |