Irish vs British Female Poverty Among 25-34 Year Olds
COMPARE
Irish
British
Female Poverty Among 25-34 Year Olds
Female Poverty Among 25-34 Year Olds Comparison
Irish
British
13.7%
FEMALE POVERTY AMONG 25-34 YEAR OLDS
35.3/ 100
METRIC RATING
185th/ 347
METRIC RANK
13.4%
FEMALE POVERTY AMONG 25-34 YEAR OLDS
63.5/ 100
METRIC RATING
163rd/ 347
METRIC RANK
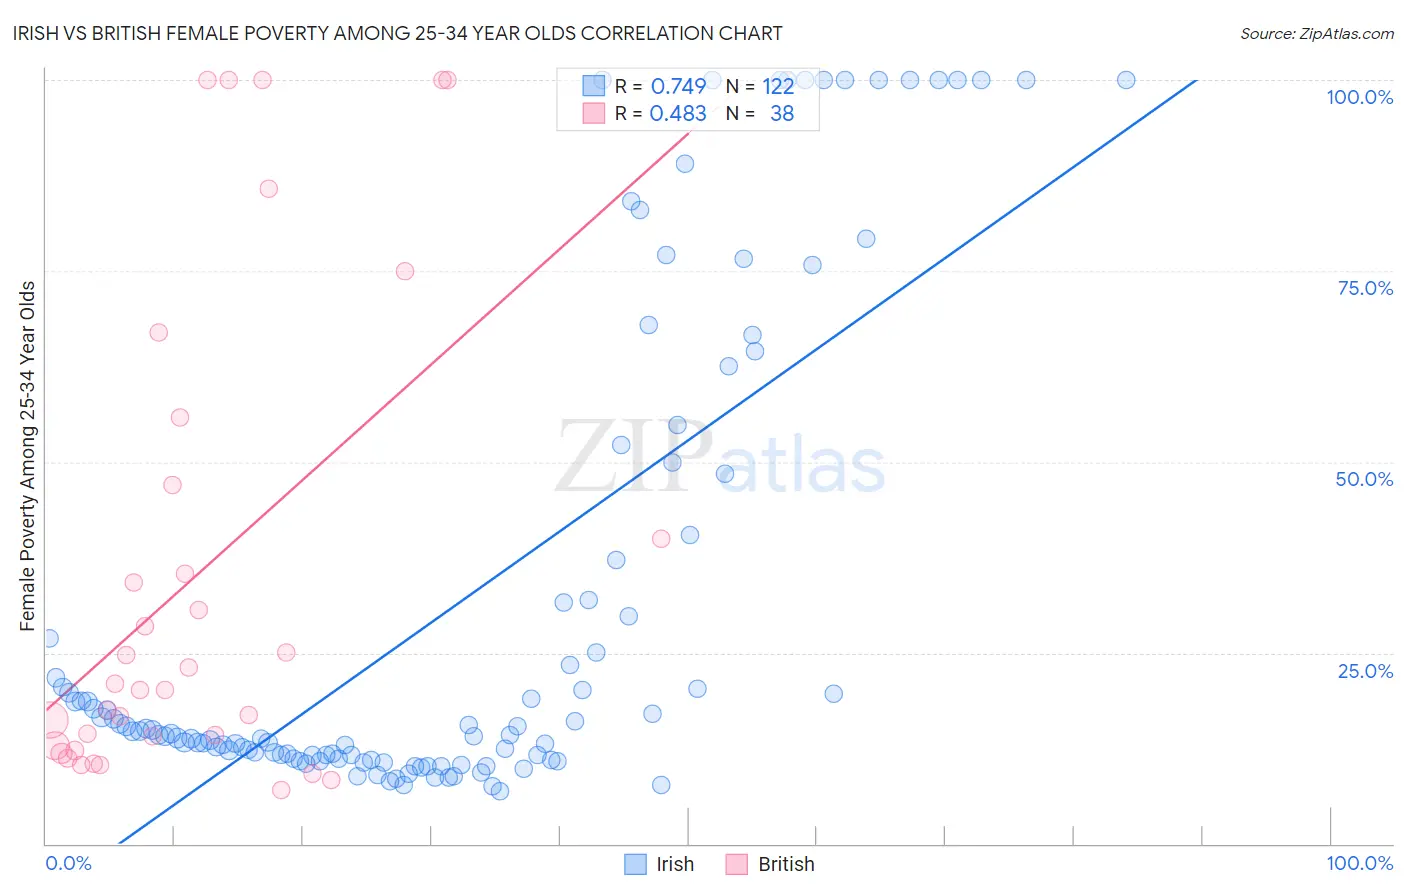
Irish vs British Female Poverty Among 25-34 Year Olds Correlation Chart
The statistical analysis conducted on geographies consisting of 555,342,984 people shows a strong positive correlation between the proportion of Irish and poverty level among females between the ages 25 and 34 in the United States with a correlation coefficient (R) of 0.749 and weighted average of 13.7%. Similarly, the statistical analysis conducted on geographies consisting of 515,268,624 people shows a moderate positive correlation between the proportion of British and poverty level among females between the ages 25 and 34 in the United States with a correlation coefficient (R) of 0.483 and weighted average of 13.4%, a difference of 2.4%.
Female Poverty Among 25-34 Year Olds Correlation Summary
| Measurement | Irish | British |
| Minimum | 6.8% | 7.0% |
| Maximum | 100.0% | 100.0% |
| Range | 93.2% | 93.0% |
| Mean | 31.0% | 35.4% |
| Median | 14.6% | 20.6% |
| Interquartile 25% (IQ1) | 11.5% | 12.8% |
| Interquartile 75% (IQ3) | 37.1% | 46.9% |
| Interquartile Range (IQR) | 25.6% | 34.1% |
| Standard Deviation (Sample) | 31.4% | 31.5% |
| Standard Deviation (Population) | 31.3% | 31.1% |
Similar Demographics by Female Poverty Among 25-34 Year Olds
Demographics Similar to Irish by Female Poverty Among 25-34 Year Olds
In terms of female poverty among 25-34 year olds, the demographic groups most similar to Irish are Immigrants from Uruguay (13.7%, a difference of 0.11%), Slovak (13.7%, a difference of 0.11%), Czechoslovakian (13.7%, a difference of 0.13%), Immigrants from Eritrea (13.7%, a difference of 0.24%), and Finnish (13.7%, a difference of 0.26%).
| Demographics | Rating | Rank | Female Poverty Among 25-34 Year Olds |
| Canadians | 44.3 /100 | #178 | Average 13.6% |
| Immigrants | Eastern Africa | 43.6 /100 | #179 | Average 13.6% |
| Germans | 41.6 /100 | #180 | Average 13.6% |
| Guamanians/Chamorros | 41.5 /100 | #181 | Average 13.6% |
| Immigrants | Venezuela | 40.7 /100 | #182 | Average 13.6% |
| Portuguese | 40.3 /100 | #183 | Average 13.6% |
| Czechoslovakians | 36.8 /100 | #184 | Fair 13.7% |
| Irish | 35.3 /100 | #185 | Fair 13.7% |
| Immigrants | Uruguay | 34.1 /100 | #186 | Fair 13.7% |
| Slovaks | 34.1 /100 | #187 | Fair 13.7% |
| Immigrants | Eritrea | 32.7 /100 | #188 | Fair 13.7% |
| Finns | 32.5 /100 | #189 | Fair 13.7% |
| Dutch | 29.7 /100 | #190 | Fair 13.8% |
| Immigrants | St. Vincent and the Grenadines | 29.3 /100 | #191 | Fair 13.8% |
| Tlingit-Haida | 28.1 /100 | #192 | Fair 13.8% |
Demographics Similar to British by Female Poverty Among 25-34 Year Olds
In terms of female poverty among 25-34 year olds, the demographic groups most similar to British are Ugandan (13.4%, a difference of 0.050%), Swiss (13.4%, a difference of 0.16%), Icelander (13.3%, a difference of 0.20%), Immigrants from South America (13.3%, a difference of 0.26%), and Uruguayan (13.3%, a difference of 0.32%).
| Demographics | Rating | Rank | Female Poverty Among 25-34 Year Olds |
| Immigrants | Cameroon | 72.0 /100 | #156 | Good 13.3% |
| Immigrants | Western Europe | 70.3 /100 | #157 | Good 13.3% |
| Immigrants | Colombia | 69.2 /100 | #158 | Good 13.3% |
| Uruguayans | 66.9 /100 | #159 | Good 13.3% |
| Immigrants | South America | 66.3 /100 | #160 | Good 13.3% |
| Icelanders | 65.7 /100 | #161 | Good 13.3% |
| Ugandans | 64.1 /100 | #162 | Good 13.4% |
| British | 63.5 /100 | #163 | Good 13.4% |
| Swiss | 61.7 /100 | #164 | Good 13.4% |
| Basques | 59.3 /100 | #165 | Average 13.4% |
| Belgians | 58.9 /100 | #166 | Average 13.4% |
| Immigrants | Bosnia and Herzegovina | 58.6 /100 | #167 | Average 13.4% |
| Immigrants | Afghanistan | 57.7 /100 | #168 | Average 13.4% |
| Samoans | 56.8 /100 | #169 | Average 13.5% |
| Immigrants | Uganda | 53.0 /100 | #170 | Average 13.5% |