Immigrants from North Macedonia vs Central American Female Poverty Among 25-34 Year Olds
COMPARE
Immigrants from North Macedonia
Central American
Female Poverty Among 25-34 Year Olds
Female Poverty Among 25-34 Year Olds Comparison
Immigrants from North Macedonia
Central Americans
11.8%
FEMALE POVERTY AMONG 25-34 YEAR OLDS
99.8/ 100
METRIC RATING
38th/ 347
METRIC RANK
15.5%
FEMALE POVERTY AMONG 25-34 YEAR OLDS
0.1/ 100
METRIC RATING
267th/ 347
METRIC RANK
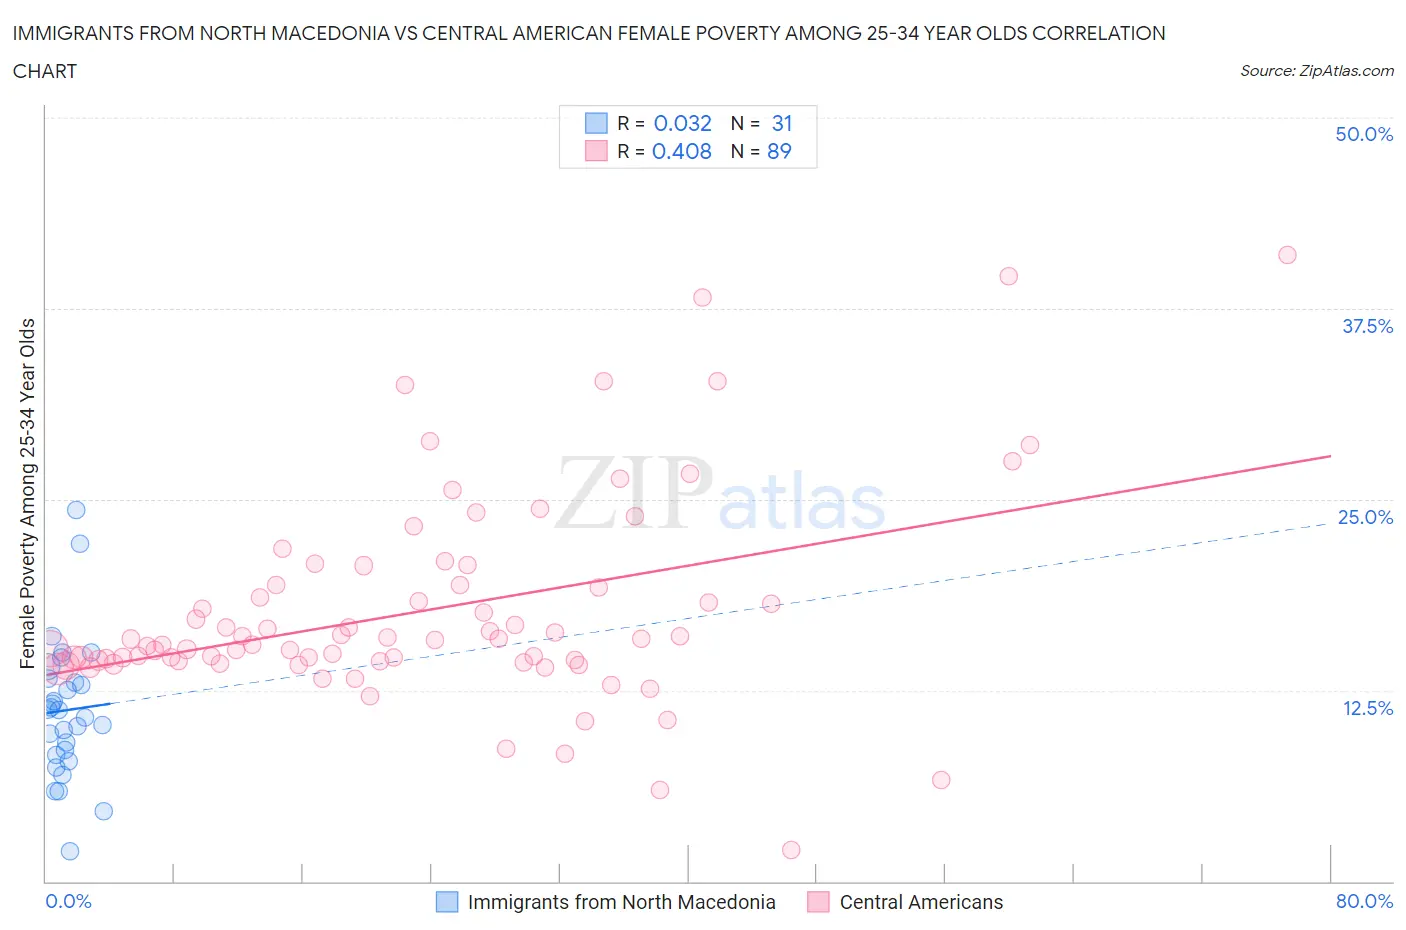
Immigrants from North Macedonia vs Central American Female Poverty Among 25-34 Year Olds Correlation Chart
The statistical analysis conducted on geographies consisting of 73,602,403 people shows no correlation between the proportion of Immigrants from North Macedonia and poverty level among females between the ages 25 and 34 in the United States with a correlation coefficient (R) of 0.032 and weighted average of 11.8%. Similarly, the statistical analysis conducted on geographies consisting of 493,853,689 people shows a moderate positive correlation between the proportion of Central Americans and poverty level among females between the ages 25 and 34 in the United States with a correlation coefficient (R) of 0.408 and weighted average of 15.5%, a difference of 31.5%.
Female Poverty Among 25-34 Year Olds Correlation Summary
| Measurement | Immigrants from North Macedonia | Central American |
| Minimum | 2.0% | 2.0% |
| Maximum | 24.3% | 41.0% |
| Range | 22.3% | 39.0% |
| Mean | 11.2% | 17.7% |
| Median | 11.2% | 15.8% |
| Interquartile 25% (IQ1) | 8.2% | 14.4% |
| Interquartile 75% (IQ3) | 13.3% | 19.4% |
| Interquartile Range (IQR) | 5.0% | 5.0% |
| Standard Deviation (Sample) | 4.6% | 6.8% |
| Standard Deviation (Population) | 4.5% | 6.8% |
Similar Demographics by Female Poverty Among 25-34 Year Olds
Demographics Similar to Immigrants from North Macedonia by Female Poverty Among 25-34 Year Olds
In terms of female poverty among 25-34 year olds, the demographic groups most similar to Immigrants from North Macedonia are Taiwanese (11.8%, a difference of 0.070%), Immigrants from Sri Lanka (11.8%, a difference of 0.23%), Latvian (11.8%, a difference of 0.25%), Immigrants from Bulgaria (11.8%, a difference of 0.41%), and Immigrants from Indonesia (11.8%, a difference of 0.54%).
| Demographics | Rating | Rank | Female Poverty Among 25-34 Year Olds |
| Immigrants | Japan | 99.9 /100 | #31 | Exceptional 11.6% |
| Immigrants | Asia | 99.9 /100 | #32 | Exceptional 11.6% |
| Immigrants | Poland | 99.9 /100 | #33 | Exceptional 11.6% |
| Zimbabweans | 99.9 /100 | #34 | Exceptional 11.7% |
| Cambodians | 99.9 /100 | #35 | Exceptional 11.7% |
| Immigrants | Sri Lanka | 99.8 /100 | #36 | Exceptional 11.8% |
| Taiwanese | 99.8 /100 | #37 | Exceptional 11.8% |
| Immigrants | North Macedonia | 99.8 /100 | #38 | Exceptional 11.8% |
| Latvians | 99.8 /100 | #39 | Exceptional 11.8% |
| Immigrants | Bulgaria | 99.8 /100 | #40 | Exceptional 11.8% |
| Immigrants | Indonesia | 99.8 /100 | #41 | Exceptional 11.8% |
| Immigrants | Turkey | 99.7 /100 | #42 | Exceptional 11.9% |
| Egyptians | 99.7 /100 | #43 | Exceptional 11.9% |
| Immigrants | Australia | 99.7 /100 | #44 | Exceptional 11.9% |
| Macedonians | 99.7 /100 | #45 | Exceptional 11.9% |
Demographics Similar to Central Americans by Female Poverty Among 25-34 Year Olds
In terms of female poverty among 25-34 year olds, the demographic groups most similar to Central Americans are Immigrants from Somalia (15.4%, a difference of 0.38%), Immigrants from Liberia (15.4%, a difference of 0.39%), Pennsylvania German (15.4%, a difference of 0.42%), Immigrants from Senegal (15.6%, a difference of 0.42%), and Subsaharan African (15.6%, a difference of 0.64%).
| Demographics | Rating | Rank | Female Poverty Among 25-34 Year Olds |
| Marshallese | 0.2 /100 | #260 | Tragic 15.3% |
| Liberians | 0.2 /100 | #261 | Tragic 15.3% |
| Immigrants | Belize | 0.2 /100 | #262 | Tragic 15.3% |
| Mexican American Indians | 0.2 /100 | #263 | Tragic 15.4% |
| Pennsylvania Germans | 0.1 /100 | #264 | Tragic 15.4% |
| Immigrants | Liberia | 0.1 /100 | #265 | Tragic 15.4% |
| Immigrants | Somalia | 0.1 /100 | #266 | Tragic 15.4% |
| Central Americans | 0.1 /100 | #267 | Tragic 15.5% |
| Immigrants | Senegal | 0.1 /100 | #268 | Tragic 15.6% |
| Sub-Saharan Africans | 0.1 /100 | #269 | Tragic 15.6% |
| British West Indians | 0.1 /100 | #270 | Tragic 15.6% |
| Cree | 0.1 /100 | #271 | Tragic 15.6% |
| Senegalese | 0.1 /100 | #272 | Tragic 15.6% |
| Immigrants | Nonimmigrants | 0.1 /100 | #273 | Tragic 15.6% |
| Immigrants | Caribbean | 0.0 /100 | #274 | Tragic 15.7% |