Puerto Rican vs Central American Female Poverty Among 25-34 Year Olds
COMPARE
Puerto Rican
Central American
Female Poverty Among 25-34 Year Olds
Female Poverty Among 25-34 Year Olds Comparison
Puerto Ricans
Central Americans
26.3%
FEMALE POVERTY AMONG 25-34 YEAR OLDS
0.0/ 100
METRIC RATING
347th/ 347
METRIC RANK
15.5%
FEMALE POVERTY AMONG 25-34 YEAR OLDS
0.1/ 100
METRIC RATING
267th/ 347
METRIC RANK
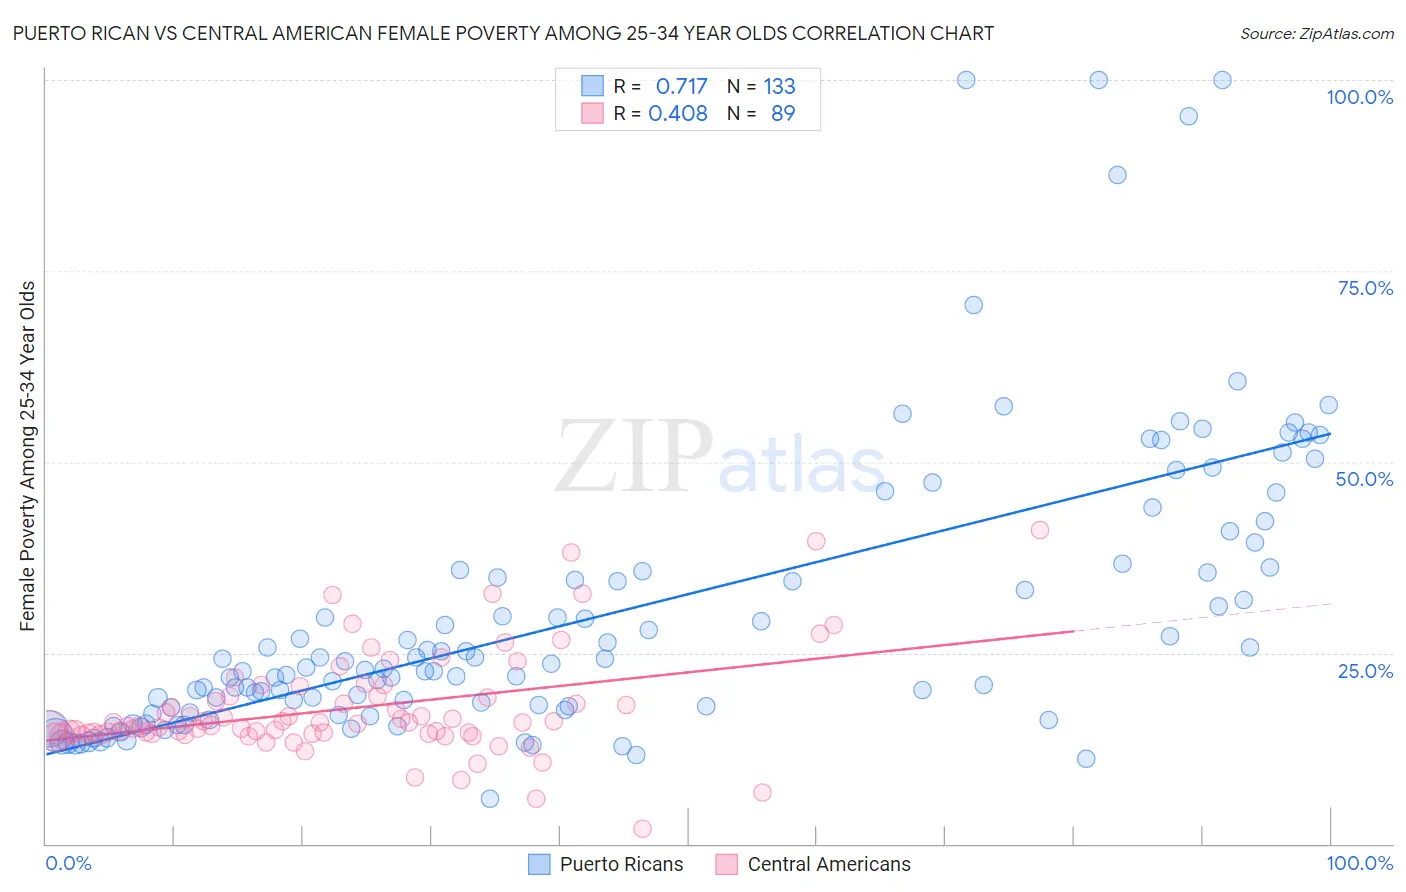
Puerto Rican vs Central American Female Poverty Among 25-34 Year Olds Correlation Chart
The statistical analysis conducted on geographies consisting of 514,481,871 people shows a strong positive correlation between the proportion of Puerto Ricans and poverty level among females between the ages 25 and 34 in the United States with a correlation coefficient (R) of 0.717 and weighted average of 26.3%. Similarly, the statistical analysis conducted on geographies consisting of 493,853,689 people shows a moderate positive correlation between the proportion of Central Americans and poverty level among females between the ages 25 and 34 in the United States with a correlation coefficient (R) of 0.408 and weighted average of 15.5%, a difference of 69.7%.
Female Poverty Among 25-34 Year Olds Correlation Summary
| Measurement | Puerto Rican | Central American |
| Minimum | 6.0% | 2.0% |
| Maximum | 100.0% | 41.0% |
| Range | 94.0% | 39.0% |
| Mean | 30.0% | 17.7% |
| Median | 22.9% | 15.8% |
| Interquartile 25% (IQ1) | 17.3% | 14.4% |
| Interquartile 75% (IQ3) | 35.8% | 19.4% |
| Interquartile Range (IQR) | 18.5% | 5.0% |
| Standard Deviation (Sample) | 19.0% | 6.8% |
| Standard Deviation (Population) | 18.9% | 6.8% |
Similar Demographics by Female Poverty Among 25-34 Year Olds
Demographics Similar to Puerto Ricans by Female Poverty Among 25-34 Year Olds
In terms of female poverty among 25-34 year olds, the demographic groups most similar to Puerto Ricans are Lumbee (26.3%, a difference of 0.030%), Pima (25.3%, a difference of 3.9%), Tohono O'odham (24.7%, a difference of 6.2%), Yup'ik (24.3%, a difference of 8.1%), and Hopi (23.7%, a difference of 11.0%).
| Demographics | Rating | Rank | Female Poverty Among 25-34 Year Olds |
| Cajuns | 0.0 /100 | #333 | Tragic 19.9% |
| Apache | 0.0 /100 | #334 | Tragic 20.1% |
| Natives/Alaskans | 0.0 /100 | #335 | Tragic 20.3% |
| Pueblo | 0.0 /100 | #336 | Tragic 22.2% |
| Crow | 0.0 /100 | #337 | Tragic 22.7% |
| Houma | 0.0 /100 | #338 | Tragic 22.7% |
| Yuman | 0.0 /100 | #339 | Tragic 22.9% |
| Sioux | 0.0 /100 | #340 | Tragic 23.0% |
| Navajo | 0.0 /100 | #341 | Tragic 23.3% |
| Hopi | 0.0 /100 | #342 | Tragic 23.7% |
| Yup'ik | 0.0 /100 | #343 | Tragic 24.3% |
| Tohono O'odham | 0.0 /100 | #344 | Tragic 24.7% |
| Pima | 0.0 /100 | #345 | Tragic 25.3% |
| Lumbee | 0.0 /100 | #346 | Tragic 26.3% |
| Puerto Ricans | 0.0 /100 | #347 | Tragic 26.3% |
Demographics Similar to Central Americans by Female Poverty Among 25-34 Year Olds
In terms of female poverty among 25-34 year olds, the demographic groups most similar to Central Americans are Immigrants from Somalia (15.4%, a difference of 0.38%), Immigrants from Liberia (15.4%, a difference of 0.39%), Pennsylvania German (15.4%, a difference of 0.42%), Immigrants from Senegal (15.6%, a difference of 0.42%), and Subsaharan African (15.6%, a difference of 0.64%).
| Demographics | Rating | Rank | Female Poverty Among 25-34 Year Olds |
| Marshallese | 0.2 /100 | #260 | Tragic 15.3% |
| Liberians | 0.2 /100 | #261 | Tragic 15.3% |
| Immigrants | Belize | 0.2 /100 | #262 | Tragic 15.3% |
| Mexican American Indians | 0.2 /100 | #263 | Tragic 15.4% |
| Pennsylvania Germans | 0.1 /100 | #264 | Tragic 15.4% |
| Immigrants | Liberia | 0.1 /100 | #265 | Tragic 15.4% |
| Immigrants | Somalia | 0.1 /100 | #266 | Tragic 15.4% |
| Central Americans | 0.1 /100 | #267 | Tragic 15.5% |
| Immigrants | Senegal | 0.1 /100 | #268 | Tragic 15.6% |
| Sub-Saharan Africans | 0.1 /100 | #269 | Tragic 15.6% |
| British West Indians | 0.1 /100 | #270 | Tragic 15.6% |
| Cree | 0.1 /100 | #271 | Tragic 15.6% |
| Senegalese | 0.1 /100 | #272 | Tragic 15.6% |
| Immigrants | Nonimmigrants | 0.1 /100 | #273 | Tragic 15.6% |
| Immigrants | Caribbean | 0.0 /100 | #274 | Tragic 15.7% |