Immigrants from South Eastern Asia vs Alaska Native Single Mother Poverty
COMPARE
Immigrants from South Eastern Asia
Alaska Native
Single Mother Poverty
Single Mother Poverty Comparison
Immigrants from South Eastern Asia
Alaska Natives
27.1%
SINGLE MOTHER POVERTY
99.7/ 100
METRIC RATING
52nd/ 347
METRIC RANK
30.9%
SINGLE MOTHER POVERTY
0.6/ 100
METRIC RATING
252nd/ 347
METRIC RANK
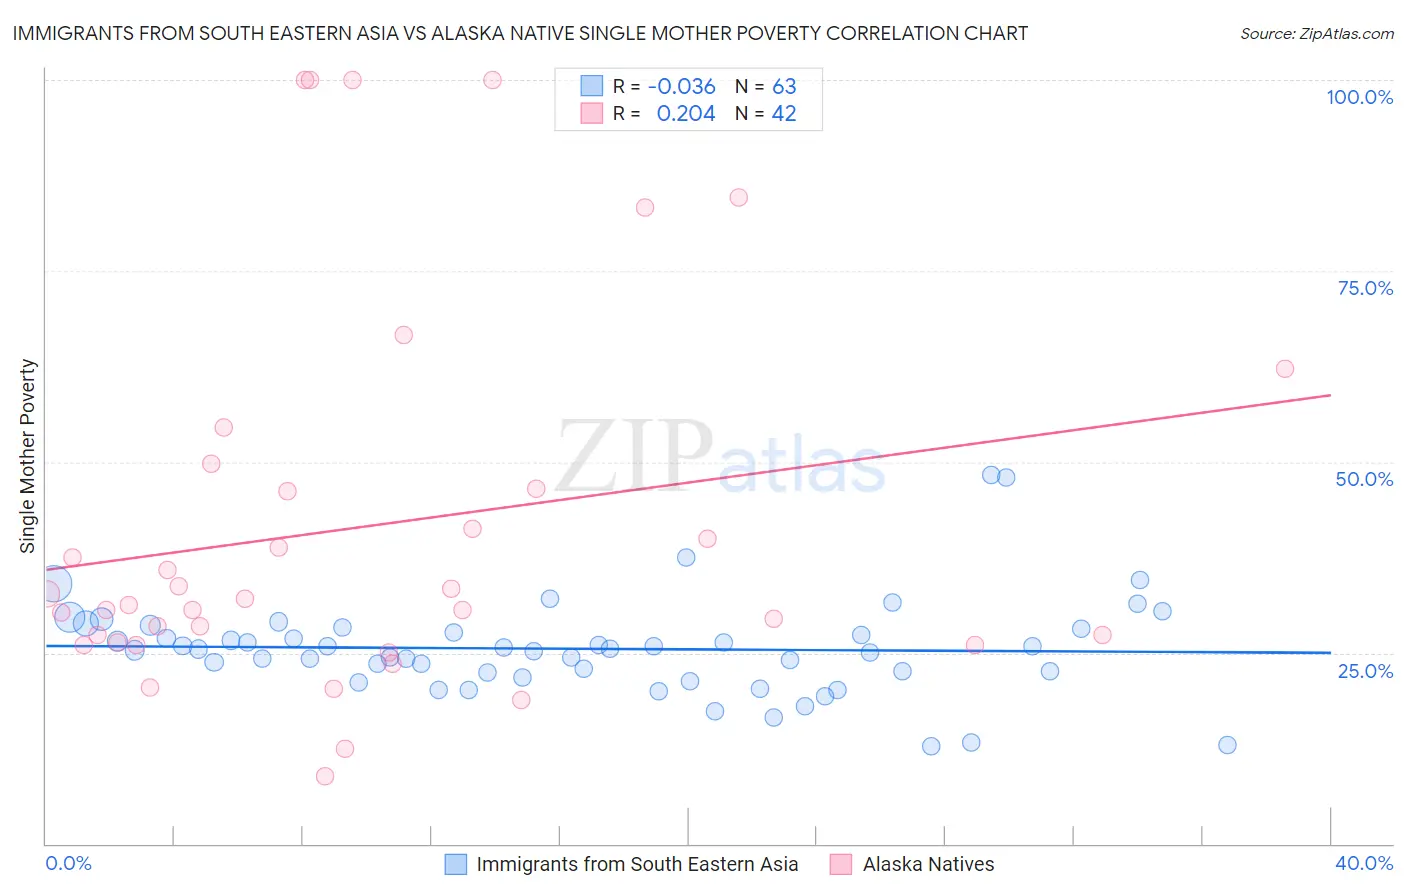
Immigrants from South Eastern Asia vs Alaska Native Single Mother Poverty Correlation Chart
The statistical analysis conducted on geographies consisting of 494,549,993 people shows no correlation between the proportion of Immigrants from South Eastern Asia and poverty level among single mothers in the United States with a correlation coefficient (R) of -0.036 and weighted average of 27.1%. Similarly, the statistical analysis conducted on geographies consisting of 76,488,214 people shows a weak positive correlation between the proportion of Alaska Natives and poverty level among single mothers in the United States with a correlation coefficient (R) of 0.204 and weighted average of 30.9%, a difference of 14.1%.
Single Mother Poverty Correlation Summary
| Measurement | Immigrants from South Eastern Asia | Alaska Native |
| Minimum | 12.7% | 8.8% |
| Maximum | 48.3% | 100.0% |
| Range | 35.5% | 91.2% |
| Mean | 25.5% | 41.6% |
| Median | 25.5% | 31.7% |
| Interquartile 25% (IQ1) | 22.4% | 26.3% |
| Interquartile 75% (IQ3) | 28.2% | 46.5% |
| Interquartile Range (IQR) | 5.7% | 20.2% |
| Standard Deviation (Sample) | 6.4% | 24.9% |
| Standard Deviation (Population) | 6.3% | 24.6% |
Similar Demographics by Single Mother Poverty
Demographics Similar to Immigrants from South Eastern Asia by Single Mother Poverty
In terms of single mother poverty, the demographic groups most similar to Immigrants from South Eastern Asia are Immigrants from Argentina (27.1%, a difference of 0.040%), Immigrants from Jordan (27.1%, a difference of 0.040%), Immigrants from Bulgaria (27.1%, a difference of 0.070%), Immigrants from Egypt (27.1%, a difference of 0.10%), and Immigrants from Romania (27.2%, a difference of 0.15%).
| Demographics | Rating | Rank | Single Mother Poverty |
| Latvians | 99.9 /100 | #45 | Exceptional 26.9% |
| Immigrants | Serbia | 99.9 /100 | #46 | Exceptional 26.9% |
| Egyptians | 99.8 /100 | #47 | Exceptional 26.9% |
| Immigrants | Poland | 99.8 /100 | #48 | Exceptional 26.9% |
| Cambodians | 99.8 /100 | #49 | Exceptional 27.0% |
| Laotians | 99.8 /100 | #50 | Exceptional 27.0% |
| Immigrants | Argentina | 99.7 /100 | #51 | Exceptional 27.1% |
| Immigrants | South Eastern Asia | 99.7 /100 | #52 | Exceptional 27.1% |
| Immigrants | Jordan | 99.7 /100 | #53 | Exceptional 27.1% |
| Immigrants | Bulgaria | 99.7 /100 | #54 | Exceptional 27.1% |
| Immigrants | Egypt | 99.7 /100 | #55 | Exceptional 27.1% |
| Immigrants | Romania | 99.7 /100 | #56 | Exceptional 27.2% |
| Palestinians | 99.7 /100 | #57 | Exceptional 27.2% |
| Argentineans | 99.6 /100 | #58 | Exceptional 27.2% |
| Paraguayans | 99.6 /100 | #59 | Exceptional 27.2% |
Demographics Similar to Alaska Natives by Single Mother Poverty
In terms of single mother poverty, the demographic groups most similar to Alaska Natives are Tlingit-Haida (30.9%, a difference of 0.010%), Celtic (30.9%, a difference of 0.030%), Vietnamese (30.9%, a difference of 0.13%), Senegalese (31.0%, a difference of 0.18%), and Cape Verdean (30.8%, a difference of 0.28%).
| Demographics | Rating | Rank | Single Mother Poverty |
| Barbadians | 1.3 /100 | #245 | Tragic 30.7% |
| Ecuadorians | 0.9 /100 | #246 | Tragic 30.8% |
| West Indians | 0.9 /100 | #247 | Tragic 30.8% |
| French Canadians | 0.9 /100 | #248 | Tragic 30.8% |
| Cape Verdeans | 0.8 /100 | #249 | Tragic 30.8% |
| Vietnamese | 0.7 /100 | #250 | Tragic 30.9% |
| Tlingit-Haida | 0.6 /100 | #251 | Tragic 30.9% |
| Alaska Natives | 0.6 /100 | #252 | Tragic 30.9% |
| Celtics | 0.6 /100 | #253 | Tragic 30.9% |
| Senegalese | 0.5 /100 | #254 | Tragic 31.0% |
| Belizeans | 0.5 /100 | #255 | Tragic 31.0% |
| Immigrants | West Indies | 0.4 /100 | #256 | Tragic 31.1% |
| Immigrants | Bahamas | 0.4 /100 | #257 | Tragic 31.1% |
| Immigrants | Caribbean | 0.4 /100 | #258 | Tragic 31.1% |
| Immigrants | Bangladesh | 0.4 /100 | #259 | Tragic 31.1% |