Iraqi vs Yuman Child Poverty Under the Age of 16
COMPARE
Iraqi
Yuman
Child Poverty Under the Age of 16
Child Poverty Under the Age of 16 Comparison
Iraqis
Yuman
17.5%
CHILD POVERTY UNDER THE AGE OF 16
5.9/ 100
METRIC RATING
214th/ 347
METRIC RANK
28.9%
CHILD POVERTY UNDER THE AGE OF 16
0.0/ 100
METRIC RATING
341st/ 347
METRIC RANK
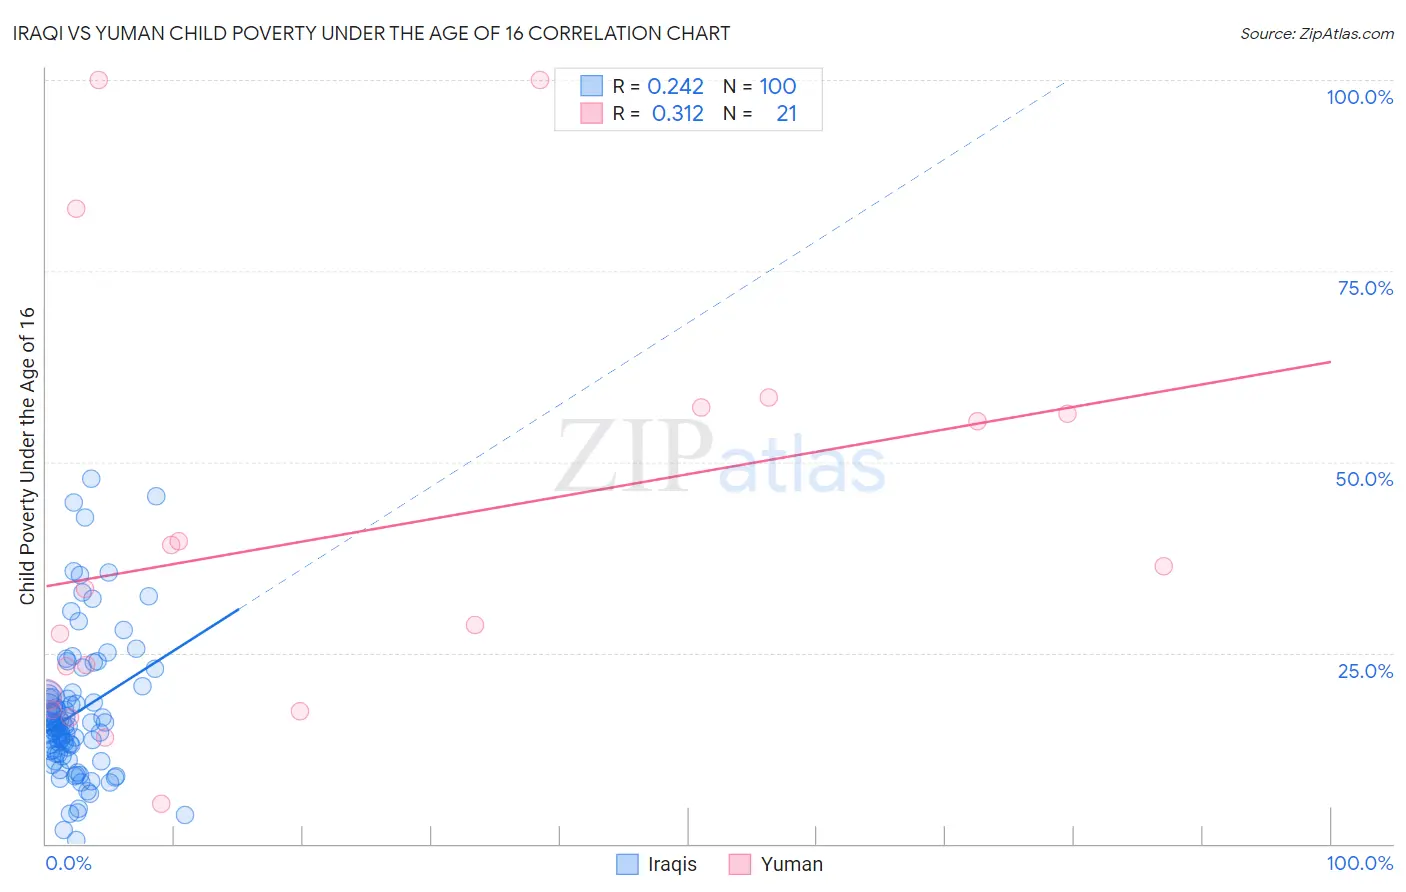
Iraqi vs Yuman Child Poverty Under the Age of 16 Correlation Chart
The statistical analysis conducted on geographies consisting of 170,217,272 people shows a weak positive correlation between the proportion of Iraqis and poverty level among children under the age of 16 in the United States with a correlation coefficient (R) of 0.242 and weighted average of 17.5%. Similarly, the statistical analysis conducted on geographies consisting of 40,623,362 people shows a mild positive correlation between the proportion of Yuman and poverty level among children under the age of 16 in the United States with a correlation coefficient (R) of 0.312 and weighted average of 28.9%, a difference of 65.0%.
Child Poverty Under the Age of 16 Correlation Summary
| Measurement | Iraqi | Yuman |
| Minimum | 0.44% | 5.3% |
| Maximum | 47.7% | 100.0% |
| Range | 47.3% | 94.7% |
| Mean | 17.2% | 40.6% |
| Median | 15.4% | 33.4% |
| Interquartile 25% (IQ1) | 11.8% | 18.5% |
| Interquartile 75% (IQ3) | 19.2% | 56.7% |
| Interquartile Range (IQR) | 7.4% | 38.2% |
| Standard Deviation (Sample) | 9.3% | 27.4% |
| Standard Deviation (Population) | 9.2% | 26.7% |
Similar Demographics by Child Poverty Under the Age of 16
Demographics Similar to Iraqis by Child Poverty Under the Age of 16
In terms of child poverty under the age of 16, the demographic groups most similar to Iraqis are Malaysian (17.5%, a difference of 0.020%), Immigrants from the Azores (17.5%, a difference of 0.12%), Sierra Leonean (17.6%, a difference of 0.13%), Immigrants (17.5%, a difference of 0.29%), and Immigrants from Thailand (17.5%, a difference of 0.31%).
| Demographics | Rating | Rank | Child Poverty Under the Age of 16 |
| German Russians | 8.6 /100 | #207 | Tragic 17.4% |
| Pennsylvania Germans | 7.5 /100 | #208 | Tragic 17.4% |
| Panamanians | 6.9 /100 | #209 | Tragic 17.5% |
| Alaskan Athabascans | 6.9 /100 | #210 | Tragic 17.5% |
| Immigrants | Thailand | 6.6 /100 | #211 | Tragic 17.5% |
| Immigrants | Immigrants | 6.5 /100 | #212 | Tragic 17.5% |
| Immigrants | Azores | 6.2 /100 | #213 | Tragic 17.5% |
| Iraqis | 5.9 /100 | #214 | Tragic 17.5% |
| Malaysians | 5.9 /100 | #215 | Tragic 17.5% |
| Sierra Leoneans | 5.7 /100 | #216 | Tragic 17.6% |
| Immigrants | Eastern Africa | 5.3 /100 | #217 | Tragic 17.6% |
| Moroccans | 5.3 /100 | #218 | Tragic 17.6% |
| Japanese | 4.7 /100 | #219 | Tragic 17.7% |
| Immigrants | Panama | 4.1 /100 | #220 | Tragic 17.7% |
| Cubans | 3.7 /100 | #221 | Tragic 17.8% |
Demographics Similar to Yuman by Child Poverty Under the Age of 16
In terms of child poverty under the age of 16, the demographic groups most similar to Yuman are Pima (29.0%, a difference of 0.26%), Immigrants from Yemen (29.1%, a difference of 0.46%), Navajo (30.2%, a difference of 4.4%), Hopi (27.1%, a difference of 6.8%), and Lumbee (31.0%, a difference of 7.0%).
| Demographics | Rating | Rank | Child Poverty Under the Age of 16 |
| Immigrants | Dominican Republic | 0.0 /100 | #333 | Tragic 24.0% |
| Blacks/African Americans | 0.0 /100 | #334 | Tragic 24.4% |
| Houma | 0.0 /100 | #335 | Tragic 24.9% |
| Yup'ik | 0.0 /100 | #336 | Tragic 25.1% |
| Sioux | 0.0 /100 | #337 | Tragic 25.2% |
| Cheyenne | 0.0 /100 | #338 | Tragic 25.4% |
| Crow | 0.0 /100 | #339 | Tragic 26.0% |
| Hopi | 0.0 /100 | #340 | Tragic 27.1% |
| Yuman | 0.0 /100 | #341 | Tragic 28.9% |
| Pima | 0.0 /100 | #342 | Tragic 29.0% |
| Immigrants | Yemen | 0.0 /100 | #343 | Tragic 29.1% |
| Navajo | 0.0 /100 | #344 | Tragic 30.2% |
| Lumbee | 0.0 /100 | #345 | Tragic 31.0% |
| Tohono O'odham | 0.0 /100 | #346 | Tragic 31.7% |
| Puerto Ricans | 0.0 /100 | #347 | Tragic 32.5% |