Iraqi vs Immigrants from Syria Child Poverty Under the Age of 16
COMPARE
Iraqi
Immigrants from Syria
Child Poverty Under the Age of 16
Child Poverty Under the Age of 16 Comparison
Iraqis
Immigrants from Syria
17.5%
CHILD POVERTY UNDER THE AGE OF 16
5.9/ 100
METRIC RATING
214th/ 347
METRIC RANK
16.4%
CHILD POVERTY UNDER THE AGE OF 16
42.3/ 100
METRIC RATING
179th/ 347
METRIC RANK
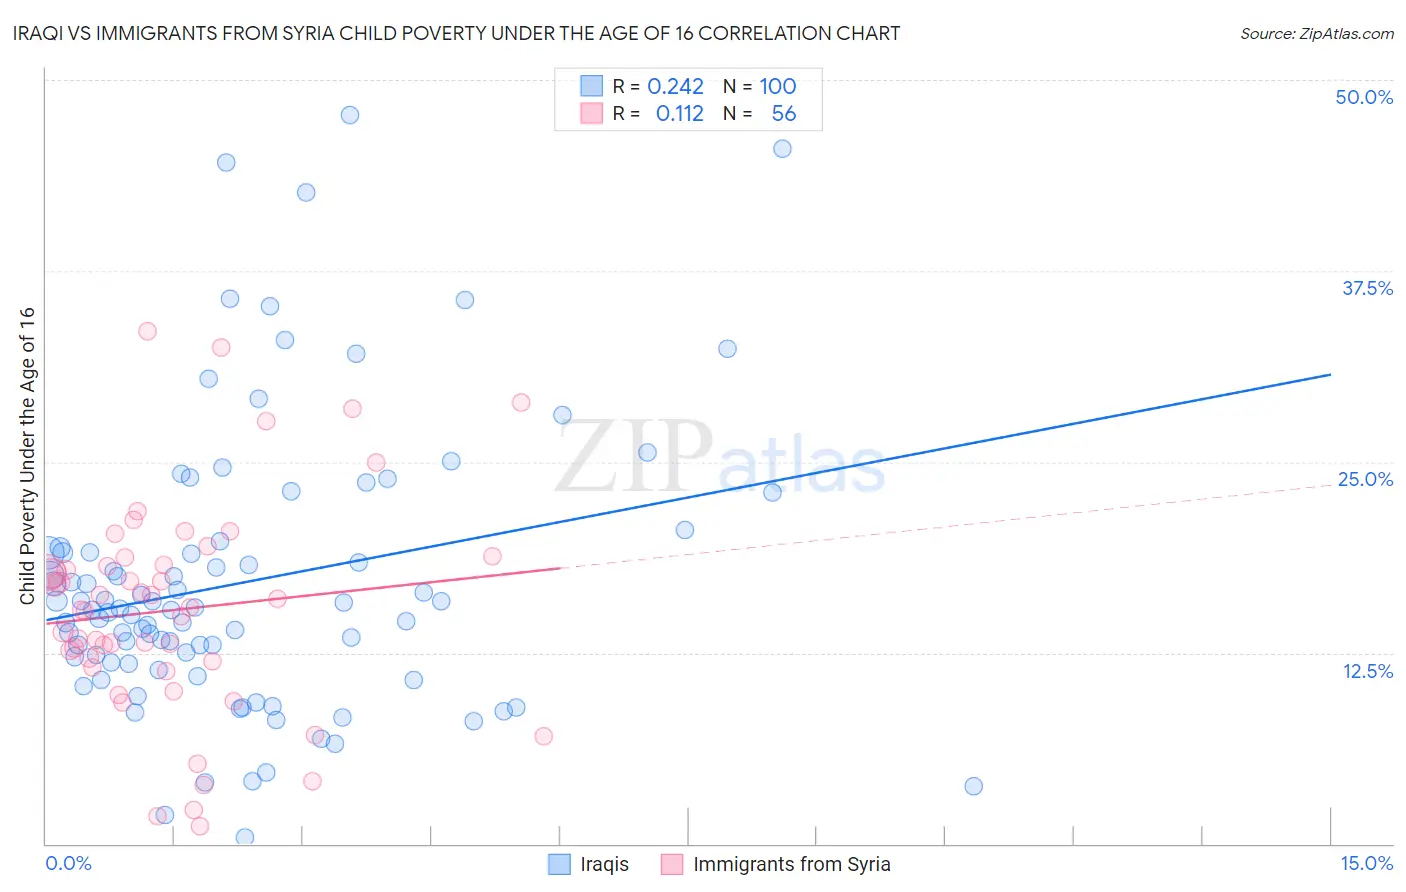
Iraqi vs Immigrants from Syria Child Poverty Under the Age of 16 Correlation Chart
The statistical analysis conducted on geographies consisting of 170,217,272 people shows a weak positive correlation between the proportion of Iraqis and poverty level among children under the age of 16 in the United States with a correlation coefficient (R) of 0.242 and weighted average of 17.5%. Similarly, the statistical analysis conducted on geographies consisting of 173,660,467 people shows a poor positive correlation between the proportion of Immigrants from Syria and poverty level among children under the age of 16 in the United States with a correlation coefficient (R) of 0.112 and weighted average of 16.4%, a difference of 7.3%.
Child Poverty Under the Age of 16 Correlation Summary
| Measurement | Iraqi | Immigrants from Syria |
| Minimum | 0.44% | 1.2% |
| Maximum | 47.7% | 33.6% |
| Range | 47.3% | 32.4% |
| Mean | 17.2% | 15.3% |
| Median | 15.4% | 15.4% |
| Interquartile 25% (IQ1) | 11.8% | 11.7% |
| Interquartile 75% (IQ3) | 19.2% | 18.5% |
| Interquartile Range (IQR) | 7.4% | 6.8% |
| Standard Deviation (Sample) | 9.3% | 7.1% |
| Standard Deviation (Population) | 9.2% | 7.0% |
Similar Demographics by Child Poverty Under the Age of 16
Demographics Similar to Iraqis by Child Poverty Under the Age of 16
In terms of child poverty under the age of 16, the demographic groups most similar to Iraqis are Malaysian (17.5%, a difference of 0.020%), Immigrants from the Azores (17.5%, a difference of 0.12%), Sierra Leonean (17.6%, a difference of 0.13%), Immigrants (17.5%, a difference of 0.29%), and Immigrants from Thailand (17.5%, a difference of 0.31%).
| Demographics | Rating | Rank | Child Poverty Under the Age of 16 |
| German Russians | 8.6 /100 | #207 | Tragic 17.4% |
| Pennsylvania Germans | 7.5 /100 | #208 | Tragic 17.4% |
| Panamanians | 6.9 /100 | #209 | Tragic 17.5% |
| Alaskan Athabascans | 6.9 /100 | #210 | Tragic 17.5% |
| Immigrants | Thailand | 6.6 /100 | #211 | Tragic 17.5% |
| Immigrants | Immigrants | 6.5 /100 | #212 | Tragic 17.5% |
| Immigrants | Azores | 6.2 /100 | #213 | Tragic 17.5% |
| Iraqis | 5.9 /100 | #214 | Tragic 17.5% |
| Malaysians | 5.9 /100 | #215 | Tragic 17.5% |
| Sierra Leoneans | 5.7 /100 | #216 | Tragic 17.6% |
| Immigrants | Eastern Africa | 5.3 /100 | #217 | Tragic 17.6% |
| Moroccans | 5.3 /100 | #218 | Tragic 17.6% |
| Japanese | 4.7 /100 | #219 | Tragic 17.7% |
| Immigrants | Panama | 4.1 /100 | #220 | Tragic 17.7% |
| Cubans | 3.7 /100 | #221 | Tragic 17.8% |
Demographics Similar to Immigrants from Syria by Child Poverty Under the Age of 16
In terms of child poverty under the age of 16, the demographic groups most similar to Immigrants from Syria are Immigrants from Ethiopia (16.4%, a difference of 0.0%), South American Indian (16.4%, a difference of 0.050%), Ethiopian (16.3%, a difference of 0.13%), Immigrants from South America (16.4%, a difference of 0.18%), and Lebanese (16.3%, a difference of 0.43%).
| Demographics | Rating | Rank | Child Poverty Under the Age of 16 |
| Afghans | 52.3 /100 | #172 | Average 16.2% |
| Immigrants | Saudi Arabia | 52.1 /100 | #173 | Average 16.2% |
| Whites/Caucasians | 50.0 /100 | #174 | Average 16.2% |
| Scotch-Irish | 47.1 /100 | #175 | Average 16.3% |
| Lebanese | 45.9 /100 | #176 | Average 16.3% |
| Ethiopians | 43.4 /100 | #177 | Average 16.3% |
| Immigrants | Ethiopia | 42.3 /100 | #178 | Average 16.4% |
| Immigrants | Syria | 42.3 /100 | #179 | Average 16.4% |
| South American Indians | 41.8 /100 | #180 | Average 16.4% |
| Immigrants | South America | 40.8 /100 | #181 | Average 16.4% |
| Hawaiians | 38.2 /100 | #182 | Fair 16.4% |
| Celtics | 38.2 /100 | #183 | Fair 16.4% |
| Immigrants | Western Asia | 38.0 /100 | #184 | Fair 16.4% |
| Immigrants | Bosnia and Herzegovina | 37.4 /100 | #185 | Fair 16.5% |
| Kenyans | 34.1 /100 | #186 | Fair 16.5% |