Iraqi vs Immigrants from Belize Child Poverty Under the Age of 16

COMPARE

Iraqi
Race
Ancestry
AfghanAfricanAlaska NativeAlaskan AthabascanAlbanianAleutAlsatianAmericanApacheArabArapahoArgentineanArmenianAssyrian/Chaldean/SyriacAustralianAustrianBahamianBangladeshiBarbadianBasqueBelgianBelizeanBermudanBhutaneseBlackfeetBolivianBrazilianBritishBritish West IndianBulgarianBurmeseCajunCambodianCanadianCape VerdeanCarpatho RusynCelticCentral AmericanCentral American IndianCherokeeCheyenneChickasawChileanChineseChippewaChoctawColombianColvilleComancheCosta RicanCreeCreekCroatianCrowCubanCypriotCzechCzechoslovakianDanishDelawareDominicanDutchDutch West IndianEastern EuropeanEcuadorianEgyptianEnglishEstonianEthiopianEuropeanFijianFilipinoFinnishFrenchFrench American IndianFrench CanadianGermanGerman RussianGhanaianGreekGuamanian/ChamorroGuatemalanGuyaneseHaitianHmongHonduranHopiHoumaHungarianIcelanderIndian (Asian)IndonesianInupiatIranianIraqiIrishIroquoisIsraeliItalianJamaicanJapaneseJordanianKenyanKiowaKoreanLaotianLatvianLebaneseLiberianLithuanianLumbeeLuxembourgerMacedonianMalaysianMalteseMarshalleseMenomineeMexicanMexican American IndianMongolianMoroccanNative HawaiianNavajoNepaleseNew ZealanderNicaraguanNigerianNorthern EuropeanNorwegianOkinawanOsageOttawaPaiutePakistaniPalestinianPanamanianParaguayanPennsylvania GermanPeruvianPimaPolishPortuguesePotawatomiPuebloPuerto RicanPuget Sound SalishRomanianRussianSalvadoranSamoanScandinavianScotch-IrishScottishSeminoleSenegaleseSerbianShoshoneSierra LeoneanSiouxSlavicSlovakSloveneSomaliSouth AfricanSouth AmericanSouth American IndianSoviet UnionSpaniardSpanishSpanish AmericanSpanish American IndianSri LankanSubsaharan AfricanSudaneseSwedishSwissSyrianTaiwaneseThaiTlingit-HaidaTohono O'OdhamTonganTrinidadian and TobagonianTsimshianTurkishU.S. Virgin IslanderUgandanUkrainianUruguayanUteVenezuelanVietnameseWelshWest IndianYakamaYaquiYugoslavianYumanYup'ikZimbabwean
Immigration
NonimmigrantsImmigrantsAfghanistanAfricaAlbaniaArgentinaArmeniaAsiaAustraliaAustriaBahamasBangladeshBarbadosBelarusBelgiumBoliviaBosnia and HerzegovinaBrazilBulgariaBurma/MyanmarCabo VerdeCambodiaCameroonCanadaCaribbeanCentral AmericaChileChinaColombiaCongoCosta RicaCroatiaCubaCzechoslovakiaDenmarkDominicaDominican RepublicEastern AfricaEastern AsiaEastern EuropeEcuadorEgyptEl SalvadorEnglandEritreaEthiopiaEuropeFijiFranceGermanyGhanaGreeceGrenadaGuatemalaGuyanaHaitiHondurasHong KongHungaryIndiaIndonesiaIranIraqIrelandIsraelItalyJamaicaJapanJordanKazakhstanKenyaKoreaKuwaitLaosLatin AmericaLatviaLebanonLiberiaLithuaniaMalaysiaMexicoMicronesiaMiddle AfricaMoldovaMoroccoNepalNetherlandsNicaraguaNigeriaNorth AmericaNorth MacedoniaNorthern AfricaNorthern EuropeNorwayOceaniaPakistanPanamaPeruPhilippinesPolandPortugalRomaniaRussiaSaudi ArabiaScotlandSenegalSerbiaSierra LeoneSingaporeSomaliaSouth AfricaSouth AmericaSouth Central AsiaSouth Eastern AsiaSouthern EuropeSpainSri LankaSt. Vincent and the GrenadinesSudanSwedenSwitzerlandSyriaTaiwanThailandTrinidad and TobagoTurkeyUgandaUkraineUruguayUzbekistanVenezuelaVietnamWest IndiesWestern AfricaWestern AsiaWestern EuropeYemenZaireZimbabweAzores
Immigrants from Belize
Race
Ancestry
AfghanAfricanAlaska NativeAlaskan AthabascanAlbanianAleutAlsatianAmericanApacheArabArapahoArgentineanArmenianAssyrian/Chaldean/SyriacAustralianAustrianBahamianBangladeshiBarbadianBasqueBelgianBelizeanBermudanBhutaneseBlackfeetBolivianBrazilianBritishBritish West IndianBulgarianBurmeseCajunCambodianCanadianCape VerdeanCarpatho RusynCelticCentral AmericanCentral American IndianCherokeeCheyenneChickasawChileanChineseChippewaChoctawColombianColvilleComancheCosta RicanCreeCreekCroatianCrowCubanCypriotCzechCzechoslovakianDanishDelawareDominicanDutchDutch West IndianEastern EuropeanEcuadorianEgyptianEnglishEstonianEthiopianEuropeanFijianFilipinoFinnishFrenchFrench American IndianFrench CanadianGermanGerman RussianGhanaianGreekGuamanian/ChamorroGuatemalanGuyaneseHaitianHmongHonduranHopiHoumaHungarianIcelanderIndian (Asian)IndonesianInupiatIranianIrishIroquoisIsraeliItalianJamaicanJapaneseJordanianKenyanKiowaKoreanLaotianLatvianLebaneseLiberianLithuanianLumbeeLuxembourgerMacedonianMalaysianMalteseMarshalleseMenomineeMexicanMexican American IndianMongolianMoroccanNative HawaiianNavajoNepaleseNew ZealanderNicaraguanNigerianNorthern EuropeanNorwegianOkinawanOsageOttawaPaiutePakistaniPalestinianPanamanianParaguayanPennsylvania GermanPeruvianPimaPolishPortuguesePotawatomiPuebloPuerto RicanPuget Sound SalishRomanianRussianSalvadoranSamoanScandinavianScotch-IrishScottishSeminoleSenegaleseSerbianShoshoneSierra LeoneanSiouxSlavicSlovakSloveneSomaliSouth AfricanSouth AmericanSouth American IndianSoviet UnionSpaniardSpanishSpanish AmericanSpanish American IndianSri LankanSubsaharan AfricanSudaneseSwedishSwissSyrianTaiwaneseThaiTlingit-HaidaTohono O'OdhamTonganTrinidadian and TobagonianTsimshianTurkishU.S. Virgin IslanderUgandanUkrainianUruguayanUteVenezuelanVietnameseWelshWest IndianYakamaYaquiYugoslavianYumanYup'ikZimbabwean
Immigration
NonimmigrantsImmigrantsAfghanistanAfricaAlbaniaArgentinaArmeniaAsiaAustraliaAustriaBahamasBangladeshBarbadosBelarusBelgiumBelizeBoliviaBosnia and HerzegovinaBrazilBulgariaBurma/MyanmarCabo VerdeCambodiaCameroonCanadaCaribbeanCentral AmericaChileChinaColombiaCongoCosta RicaCroatiaCubaCzechoslovakiaDenmarkDominicaDominican RepublicEastern AfricaEastern AsiaEastern EuropeEcuadorEgyptEl SalvadorEnglandEritreaEthiopiaEuropeFijiFranceGermanyGhanaGreeceGrenadaGuatemalaGuyanaHaitiHondurasHong KongHungaryIndiaIndonesiaIranIraqIrelandIsraelItalyJamaicaJapanJordanKazakhstanKenyaKoreaKuwaitLaosLatin AmericaLatviaLebanonLiberiaLithuaniaMalaysiaMexicoMicronesiaMiddle AfricaMoldovaMoroccoNepalNetherlandsNicaraguaNigeriaNorth AmericaNorth MacedoniaNorthern AfricaNorthern EuropeNorwayOceaniaPakistanPanamaPeruPhilippinesPolandPortugalRomaniaRussiaSaudi ArabiaScotlandSenegalSerbiaSierra LeoneSingaporeSomaliaSouth AfricaSouth AmericaSouth Central AsiaSouth Eastern AsiaSouthern EuropeSpainSri LankaSt. Vincent and the GrenadinesSudanSwedenSwitzerlandSyriaTaiwanThailandTrinidad and TobagoTurkeyUgandaUkraineUruguayUzbekistanVenezuelaVietnamWest IndiesWestern AfricaWestern AsiaWestern EuropeYemenZaireZimbabweAzores
Child Poverty Under the Age of 16
Income
Poverty
Unemployment
Labor Participation
Family Structure
Vehicle Availability
Education Level
Disability

Child Poverty Under the Age of 16 Comparison

Iraqis

Immigrants from Belize

Tragic
Tragic
17.5%
CHILD POVERTY UNDER THE AGE OF 16
5.9/ 100
METRIC RATING
214th/ 347
METRIC RANK
20.3%
CHILD POVERTY UNDER THE AGE OF 16
0.0/ 100
METRIC RATING
288th/ 347
METRIC RANK

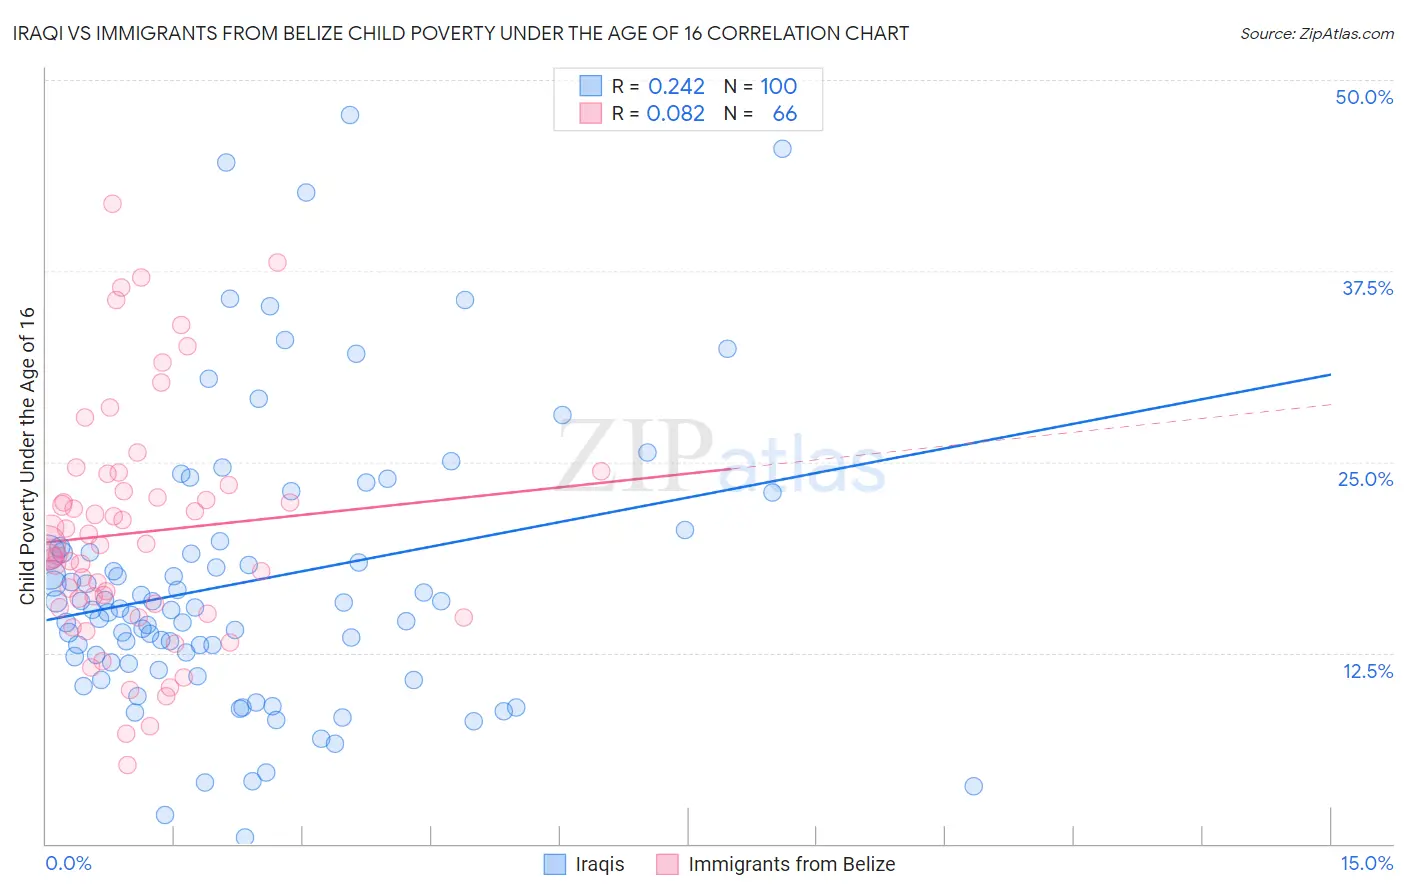
Iraqi vs Immigrants from Belize Child Poverty Under the Age of 16 Correlation Chart

The statistical analysis conducted on geographies consisting of 170,217,272 people shows a weak positive correlation between the proportion of Iraqis and poverty level among children under the age of 16 in the United States with a correlation coefficient (R) of 0.242 and weighted average of 17.5%. Similarly, the statistical analysis conducted on geographies consisting of 130,133,113 people shows a slight positive correlation between the proportion of Immigrants from Belize and poverty level among children under the age of 16 in the United States with a correlation coefficient (R) of 0.082 and weighted average of 20.3%, a difference of 15.8%.
Iraqi vs Immigrants from Belize Child Poverty Under the Age of 16

Child Poverty Under the Age of 16 Correlation Summary

MeasurementIraqiImmigrants from Belize
Minimum0.44%5.2%
Maximum47.7%41.9%
Range47.3%36.7%
Mean17.2%20.4%
Median15.4%19.6%
Interquartile 25% (IQ1)11.8%15.4%
Interquartile 75% (IQ3)19.2%23.5%
Interquartile Range (IQR)7.4%8.1%
Standard Deviation (Sample)9.3%7.8%
Standard Deviation (Population)9.2%7.7%

Similar Demographics by Child Poverty Under the Age of 16

Demographics Similar to Iraqis by Child Poverty Under the Age of 16

In terms of child poverty under the age of 16, the demographic groups most similar to Iraqis are Malaysian (17.5%, a difference of 0.020%), Immigrants from the Azores (17.5%, a difference of 0.12%), Sierra Leonean (17.6%, a difference of 0.13%), Immigrants (17.5%, a difference of 0.29%), and Immigrants from Thailand (17.5%, a difference of 0.31%).
DemographicsRating | RankChild Poverty Under the Age of 16
German Russians
8.6
/100
|
#207
Tragic
17.4%
Pennsylvania Germans
7.5
/100
|
#208
Tragic
17.4%
Panamanians
6.9
/100
|
#209
Tragic
17.5%
Alaskan Athabascans
6.9
/100
|
#210
Tragic
17.5%
Immigrants | Thailand
6.6
/100
|
#211
Tragic
17.5%
Immigrants | Immigrants
6.5
/100
|
#212
Tragic
17.5%
Immigrants | Azores
6.2
/100
|
#213
Tragic
17.5%
Iraqis
5.9
/100
|
#214
Tragic
17.5%
Malaysians
5.9
/100
|
#215
Tragic
17.5%
Sierra Leoneans
5.7
/100
|
#216
Tragic
17.6%
Immigrants | Eastern Africa
5.3
/100
|
#217
Tragic
17.6%
Moroccans
5.3
/100
|
#218
Tragic
17.6%
Japanese
4.7
/100
|
#219
Tragic
17.7%
Immigrants | Panama
4.1
/100
|
#220
Tragic
17.7%
Cubans
3.7
/100
|
#221
Tragic
17.8%

Demographics Similar to Immigrants from Belize by Child Poverty Under the Age of 16

In terms of child poverty under the age of 16, the demographic groups most similar to Immigrants from Belize are Senegalese (20.4%, a difference of 0.24%), Yaqui (20.4%, a difference of 0.28%), Blackfeet (20.2%, a difference of 0.59%), Immigrants from West Indies (20.2%, a difference of 0.71%), and Immigrants from St. Vincent and the Grenadines (20.1%, a difference of 0.85%).
DemographicsRating | RankChild Poverty Under the Age of 16
Central Americans
0.0
/100
|
#281
Tragic
20.0%
Barbadians
0.0
/100
|
#282
Tragic
20.0%
Immigrants | Zaire
0.0
/100
|
#283
Tragic
20.1%
West Indians
0.0
/100
|
#284
Tragic
20.1%
Immigrants | St. Vincent and the Grenadines
0.0
/100
|
#285
Tragic
20.1%
Immigrants | West Indies
0.0
/100
|
#286
Tragic
20.2%
Blackfeet
0.0
/100
|
#287
Tragic
20.2%
Immigrants | Belize
0.0
/100
|
#288
Tragic
20.3%
Senegalese
0.0
/100
|
#289
Tragic
20.4%
Yaqui
0.0
/100
|
#290
Tragic
20.4%
Chippewa
0.0
/100
|
#291
Tragic
20.5%
Immigrants | Latin America
0.0
/100
|
#292
Tragic
20.5%
Immigrants | Senegal
0.0
/100
|
#293
Tragic
20.6%
Haitians
0.0
/100
|
#294
Tragic
20.7%
Mexicans
0.0
/100
|
#295
Tragic
20.7%