Puerto Rican vs Yuman Child Poverty Under the Age of 16
COMPARE
Puerto Rican
Yuman
Child Poverty Under the Age of 16
Child Poverty Under the Age of 16 Comparison
Puerto Ricans
Yuman
32.5%
CHILD POVERTY UNDER THE AGE OF 16
0.0/ 100
METRIC RATING
347th/ 347
METRIC RANK
28.9%
CHILD POVERTY UNDER THE AGE OF 16
0.0/ 100
METRIC RATING
341st/ 347
METRIC RANK
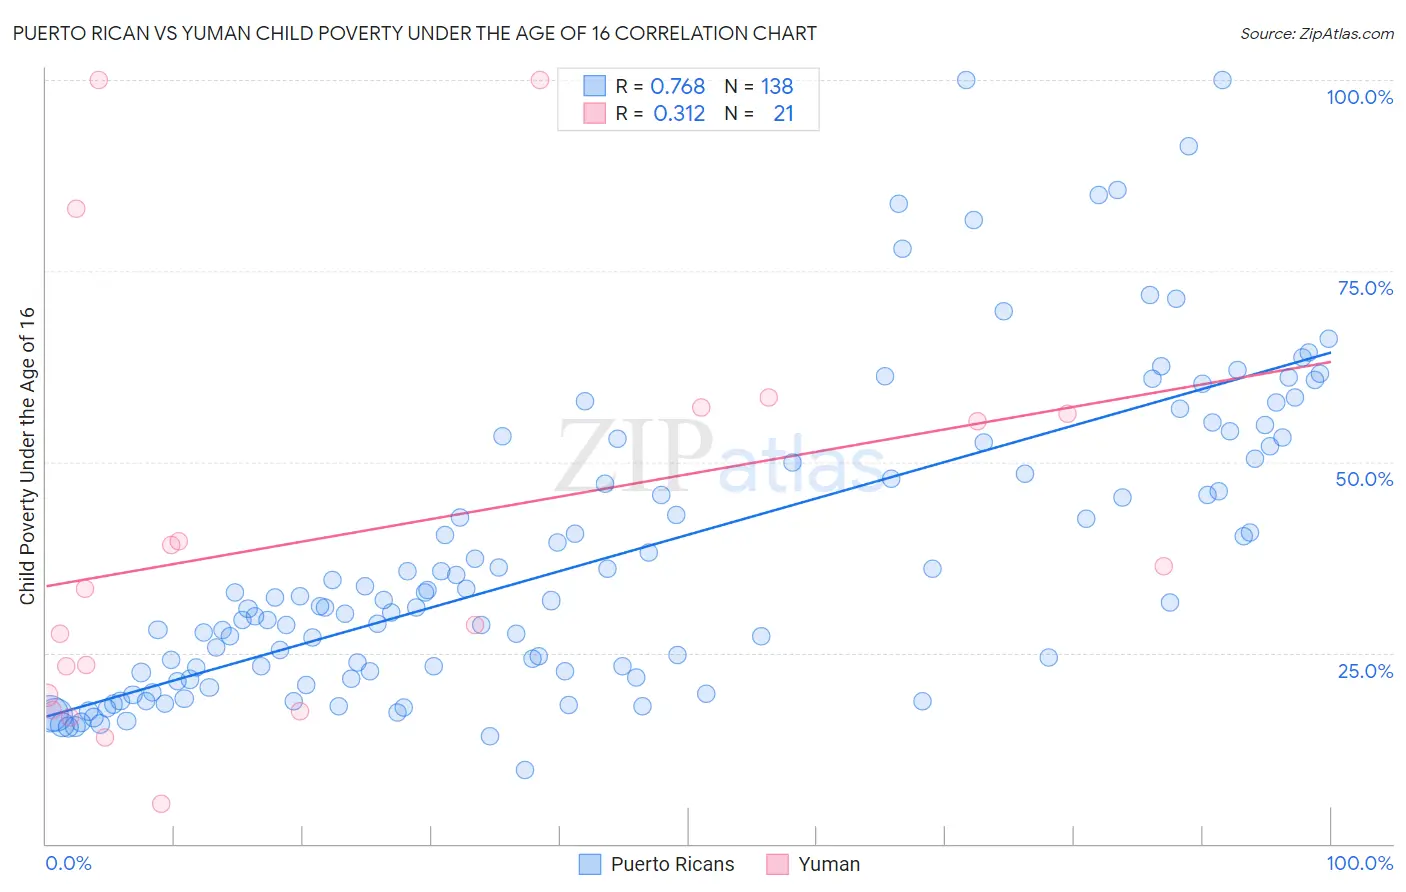
Puerto Rican vs Yuman Child Poverty Under the Age of 16 Correlation Chart
The statistical analysis conducted on geographies consisting of 520,282,787 people shows a strong positive correlation between the proportion of Puerto Ricans and poverty level among children under the age of 16 in the United States with a correlation coefficient (R) of 0.768 and weighted average of 32.5%. Similarly, the statistical analysis conducted on geographies consisting of 40,623,362 people shows a mild positive correlation between the proportion of Yuman and poverty level among children under the age of 16 in the United States with a correlation coefficient (R) of 0.312 and weighted average of 28.9%, a difference of 12.4%.
Child Poverty Under the Age of 16 Correlation Summary
| Measurement | Puerto Rican | Yuman |
| Minimum | 9.7% | 5.3% |
| Maximum | 100.0% | 100.0% |
| Range | 90.3% | 94.7% |
| Mean | 37.6% | 40.6% |
| Median | 31.7% | 33.4% |
| Interquartile 25% (IQ1) | 22.3% | 18.5% |
| Interquartile 75% (IQ3) | 50.4% | 56.7% |
| Interquartile Range (IQR) | 28.0% | 38.2% |
| Standard Deviation (Sample) | 19.8% | 27.4% |
| Standard Deviation (Population) | 19.7% | 26.7% |
Demographics Similar to Puerto Ricans and Yuman by Child Poverty Under the Age of 16
In terms of child poverty under the age of 16, the demographic groups most similar to Puerto Ricans are Tohono O'odham (31.7%, a difference of 2.6%), Lumbee (31.0%, a difference of 5.0%), Navajo (30.2%, a difference of 7.6%), Immigrants from Yemen (29.1%, a difference of 11.9%), and Pima (29.0%, a difference of 12.1%). Similarly, the demographic groups most similar to Yuman are Pima (29.0%, a difference of 0.26%), Immigrants from Yemen (29.1%, a difference of 0.46%), Navajo (30.2%, a difference of 4.4%), Hopi (27.1%, a difference of 6.8%), and Lumbee (31.0%, a difference of 7.0%).
| Demographics | Rating | Rank | Child Poverty Under the Age of 16 |
| Colville | 0.0 /100 | #328 | Tragic 23.0% |
| Dominicans | 0.0 /100 | #329 | Tragic 23.8% |
| Natives/Alaskans | 0.0 /100 | #330 | Tragic 23.8% |
| Apache | 0.0 /100 | #331 | Tragic 23.8% |
| Pueblo | 0.0 /100 | #332 | Tragic 23.9% |
| Immigrants | Dominican Republic | 0.0 /100 | #333 | Tragic 24.0% |
| Blacks/African Americans | 0.0 /100 | #334 | Tragic 24.4% |
| Houma | 0.0 /100 | #335 | Tragic 24.9% |
| Yup'ik | 0.0 /100 | #336 | Tragic 25.1% |
| Sioux | 0.0 /100 | #337 | Tragic 25.2% |
| Cheyenne | 0.0 /100 | #338 | Tragic 25.4% |
| Crow | 0.0 /100 | #339 | Tragic 26.0% |
| Hopi | 0.0 /100 | #340 | Tragic 27.1% |
| Yuman | 0.0 /100 | #341 | Tragic 28.9% |
| Pima | 0.0 /100 | #342 | Tragic 29.0% |
| Immigrants | Yemen | 0.0 /100 | #343 | Tragic 29.1% |
| Navajo | 0.0 /100 | #344 | Tragic 30.2% |
| Lumbee | 0.0 /100 | #345 | Tragic 31.0% |
| Tohono O'odham | 0.0 /100 | #346 | Tragic 31.7% |
| Puerto Ricans | 0.0 /100 | #347 | Tragic 32.5% |