Iraqi vs Immigrants from Africa Family Households with Children
COMPARE
Iraqi
Immigrants from Africa
Family Households with Children
Family Households with Children Comparison
Iraqis
Immigrants from Africa
28.5%
FAMILY HOUSEHOLDS WITH CHILDREN
99.9/ 100
METRIC RATING
73rd/ 347
METRIC RANK
28.0%
FAMILY HOUSEHOLDS WITH CHILDREN
96.8/ 100
METRIC RATING
115th/ 347
METRIC RANK
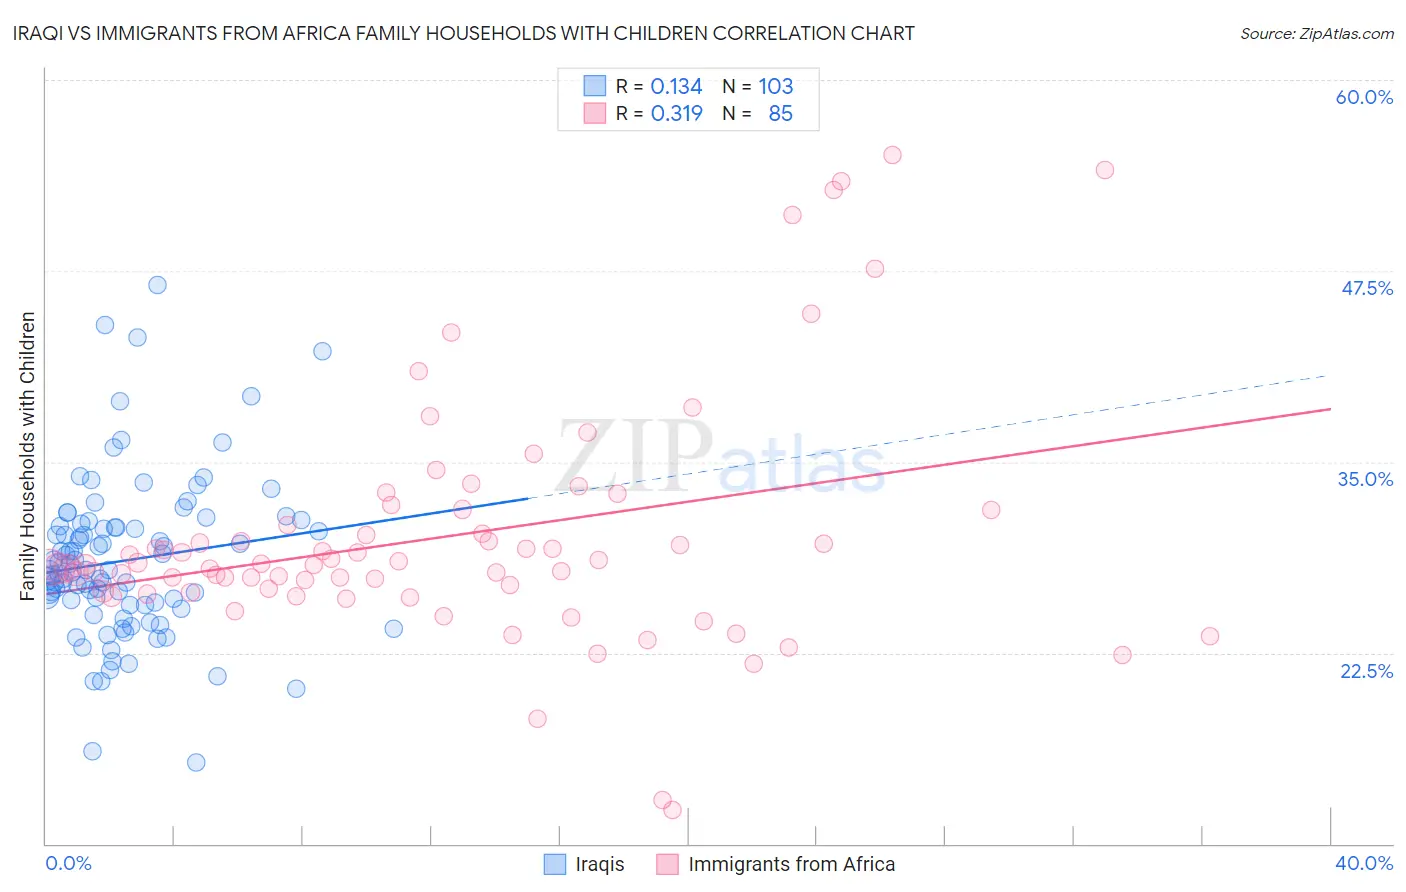
Iraqi vs Immigrants from Africa Family Households with Children Correlation Chart
The statistical analysis conducted on geographies consisting of 170,533,912 people shows a poor positive correlation between the proportion of Iraqis and percentage of family households with children in the United States with a correlation coefficient (R) of 0.134 and weighted average of 28.5%. Similarly, the statistical analysis conducted on geographies consisting of 468,727,064 people shows a mild positive correlation between the proportion of Immigrants from Africa and percentage of family households with children in the United States with a correlation coefficient (R) of 0.319 and weighted average of 28.0%, a difference of 1.9%.
Family Households with Children Correlation Summary
| Measurement | Iraqi | Immigrants from Africa |
| Minimum | 15.3% | 12.2% |
| Maximum | 46.5% | 55.1% |
| Range | 31.3% | 42.9% |
| Mean | 28.5% | 30.1% |
| Median | 27.9% | 28.3% |
| Interquartile 25% (IQ1) | 25.6% | 26.5% |
| Interquartile 75% (IQ3) | 30.8% | 31.4% |
| Interquartile Range (IQR) | 5.2% | 4.9% |
| Standard Deviation (Sample) | 5.2% | 8.0% |
| Standard Deviation (Population) | 5.2% | 7.9% |
Similar Demographics by Family Households with Children
Demographics Similar to Iraqis by Family Households with Children
In terms of family households with children, the demographic groups most similar to Iraqis are Laotian (28.5%, a difference of 0.010%), Immigrants from Indonesia (28.5%, a difference of 0.030%), Burmese (28.5%, a difference of 0.040%), Immigrants from Honduras (28.5%, a difference of 0.050%), and Immigrants from Korea (28.5%, a difference of 0.11%).
| Demographics | Rating | Rank | Family Households with Children |
| Immigrants | Egypt | 99.9 /100 | #66 | Exceptional 28.5% |
| Ghanaians | 99.9 /100 | #67 | Exceptional 28.5% |
| Houma | 99.9 /100 | #68 | Exceptional 28.5% |
| Immigrants | Korea | 99.9 /100 | #69 | Exceptional 28.5% |
| Immigrants | Honduras | 99.9 /100 | #70 | Exceptional 28.5% |
| Burmese | 99.9 /100 | #71 | Exceptional 28.5% |
| Immigrants | Indonesia | 99.9 /100 | #72 | Exceptional 28.5% |
| Iraqis | 99.9 /100 | #73 | Exceptional 28.5% |
| Laotians | 99.9 /100 | #74 | Exceptional 28.5% |
| Immigrants | Jordan | 99.9 /100 | #75 | Exceptional 28.4% |
| Immigrants | Sri Lanka | 99.9 /100 | #76 | Exceptional 28.4% |
| Nigerians | 99.8 /100 | #77 | Exceptional 28.4% |
| Immigrants | Nepal | 99.8 /100 | #78 | Exceptional 28.4% |
| Immigrants | Iraq | 99.8 /100 | #79 | Exceptional 28.4% |
| Natives/Alaskans | 99.8 /100 | #80 | Exceptional 28.4% |
Demographics Similar to Immigrants from Africa by Family Households with Children
In terms of family households with children, the demographic groups most similar to Immigrants from Africa are South American Indian (28.0%, a difference of 0.010%), Arab (28.0%, a difference of 0.030%), Immigrants from Middle Africa (28.0%, a difference of 0.040%), Scandinavian (28.0%, a difference of 0.060%), and Spaniard (28.0%, a difference of 0.13%).
| Demographics | Rating | Rank | Family Households with Children |
| Immigrants | Burma/Myanmar | 97.7 /100 | #108 | Exceptional 28.0% |
| Tohono O'odham | 97.6 /100 | #109 | Exceptional 28.0% |
| Spaniards | 97.4 /100 | #110 | Exceptional 28.0% |
| Scandinavians | 97.1 /100 | #111 | Exceptional 28.0% |
| Immigrants | Middle Africa | 97.0 /100 | #112 | Exceptional 28.0% |
| Arabs | 97.0 /100 | #113 | Exceptional 28.0% |
| South American Indians | 96.9 /100 | #114 | Exceptional 28.0% |
| Immigrants | Africa | 96.8 /100 | #115 | Exceptional 28.0% |
| Pakistanis | 96.0 /100 | #116 | Exceptional 27.9% |
| Immigrants | Malaysia | 95.9 /100 | #117 | Exceptional 27.9% |
| Central American Indians | 95.9 /100 | #118 | Exceptional 27.9% |
| Zimbabweans | 95.6 /100 | #119 | Exceptional 27.9% |
| Europeans | 95.4 /100 | #120 | Exceptional 27.9% |
| Immigrants | Western Asia | 93.6 /100 | #121 | Exceptional 27.9% |
| Immigrants | Zimbabwe | 92.8 /100 | #122 | Exceptional 27.8% |