Iranian vs Egyptian Child Poverty Among Girls Under 16
COMPARE
Iranian
Egyptian
Child Poverty Among Girls Under 16
Child Poverty Among Girls Under 16 Comparison
Iranians
Egyptians
12.4%
CHILD POVERTY AMONG GIRLS UNDER 16
100.0/ 100
METRIC RATING
8th/ 347
METRIC RANK
14.7%
CHILD POVERTY AMONG GIRLS UNDER 16
97.9/ 100
METRIC RATING
80th/ 347
METRIC RANK
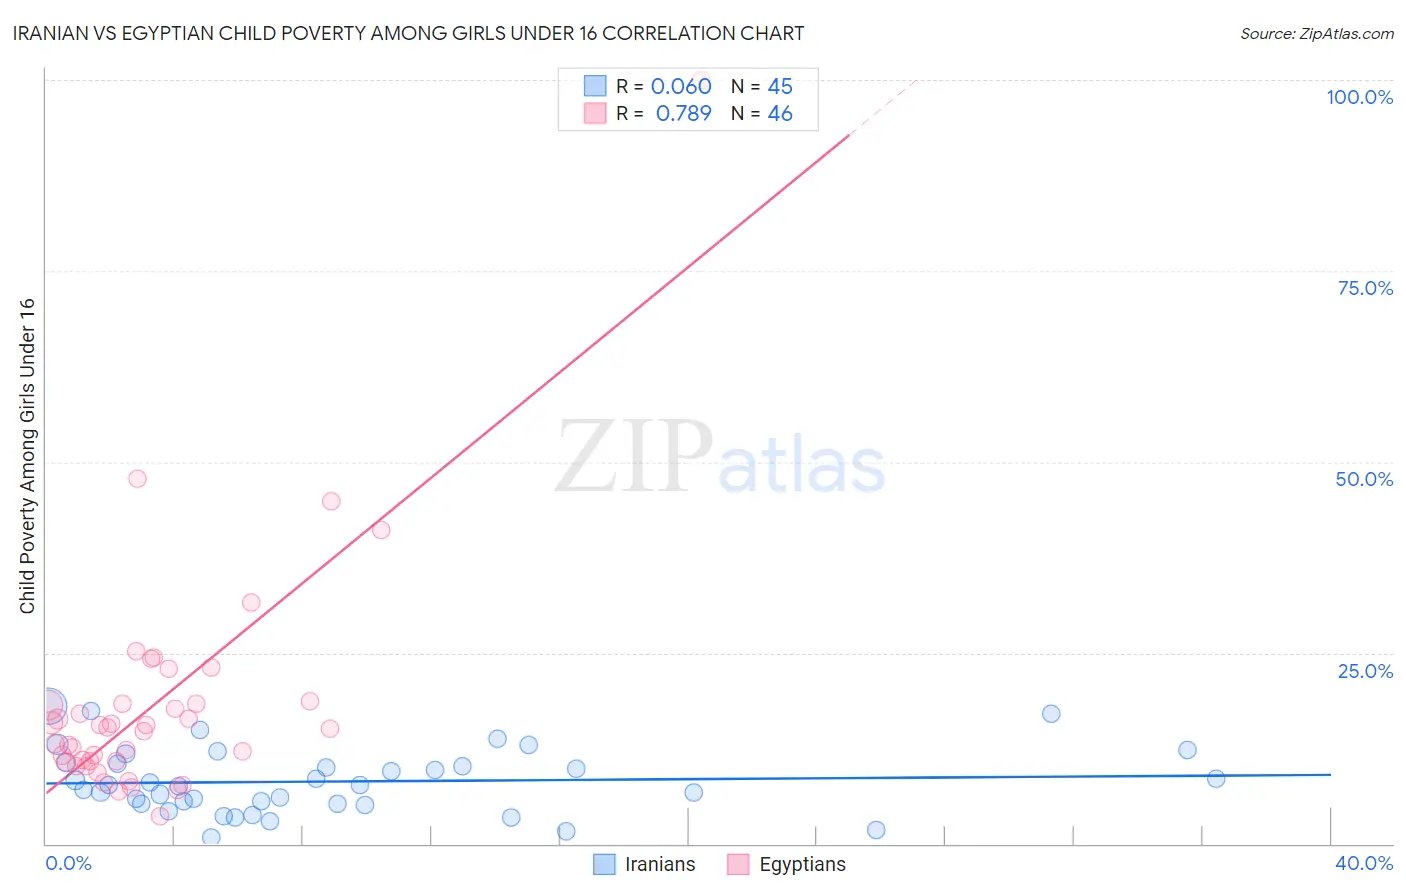
Iranian vs Egyptian Child Poverty Among Girls Under 16 Correlation Chart
The statistical analysis conducted on geographies consisting of 311,679,854 people shows a slight positive correlation between the proportion of Iranians and poverty level among girls under the age of 16 in the United States with a correlation coefficient (R) of 0.060 and weighted average of 12.4%. Similarly, the statistical analysis conducted on geographies consisting of 273,353,549 people shows a strong positive correlation between the proportion of Egyptians and poverty level among girls under the age of 16 in the United States with a correlation coefficient (R) of 0.789 and weighted average of 14.7%, a difference of 18.1%.
Child Poverty Among Girls Under 16 Correlation Summary
| Measurement | Iranian | Egyptian |
| Minimum | 0.88% | 3.6% |
| Maximum | 18.0% | 100.0% |
| Range | 17.1% | 96.4% |
| Mean | 8.2% | 18.3% |
| Median | 7.7% | 15.2% |
| Interquartile 25% (IQ1) | 5.2% | 10.8% |
| Interquartile 75% (IQ3) | 10.5% | 18.3% |
| Interquartile Range (IQR) | 5.3% | 7.6% |
| Standard Deviation (Sample) | 4.2% | 15.5% |
| Standard Deviation (Population) | 4.2% | 15.3% |
Similar Demographics by Child Poverty Among Girls Under 16
Demographics Similar to Iranians by Child Poverty Among Girls Under 16
In terms of child poverty among girls under 16, the demographic groups most similar to Iranians are Immigrants from Singapore (12.5%, a difference of 0.43%), Chinese (12.3%, a difference of 0.53%), Immigrants from Hong Kong (12.3%, a difference of 0.66%), Immigrants from Iran (12.6%, a difference of 1.4%), and Immigrants from South Central Asia (12.7%, a difference of 2.6%).
| Demographics | Rating | Rank | Child Poverty Among Girls Under 16 |
| Immigrants | India | 100.0 /100 | #1 | Exceptional 11.0% |
| Immigrants | Taiwan | 100.0 /100 | #2 | Exceptional 11.3% |
| Filipinos | 100.0 /100 | #3 | Exceptional 11.4% |
| Tsimshian | 100.0 /100 | #4 | Exceptional 11.5% |
| Thais | 100.0 /100 | #5 | Exceptional 11.8% |
| Immigrants | Hong Kong | 100.0 /100 | #6 | Exceptional 12.3% |
| Chinese | 100.0 /100 | #7 | Exceptional 12.3% |
| Iranians | 100.0 /100 | #8 | Exceptional 12.4% |
| Immigrants | Singapore | 100.0 /100 | #9 | Exceptional 12.5% |
| Immigrants | Iran | 100.0 /100 | #10 | Exceptional 12.6% |
| Immigrants | South Central Asia | 100.0 /100 | #11 | Exceptional 12.7% |
| Bhutanese | 100.0 /100 | #12 | Exceptional 12.7% |
| Immigrants | Ireland | 99.9 /100 | #13 | Exceptional 12.9% |
| Burmese | 99.9 /100 | #14 | Exceptional 13.0% |
| Okinawans | 99.9 /100 | #15 | Exceptional 13.0% |
Demographics Similar to Egyptians by Child Poverty Among Girls Under 16
In terms of child poverty among girls under 16, the demographic groups most similar to Egyptians are Immigrants from Turkey (14.7%, a difference of 0.0%), Argentinean (14.7%, a difference of 0.020%), Tlingit-Haida (14.7%, a difference of 0.030%), Immigrants from Russia (14.7%, a difference of 0.040%), and Immigrants from Eastern Europe (14.6%, a difference of 0.18%).
| Demographics | Rating | Rank | Child Poverty Among Girls Under 16 |
| Immigrants | Austria | 98.0 /100 | #73 | Exceptional 14.6% |
| Taiwanese | 98.0 /100 | #74 | Exceptional 14.6% |
| Immigrants | Eastern Europe | 98.0 /100 | #75 | Exceptional 14.6% |
| Immigrants | Russia | 97.9 /100 | #76 | Exceptional 14.7% |
| Tlingit-Haida | 97.9 /100 | #77 | Exceptional 14.7% |
| Argentineans | 97.9 /100 | #78 | Exceptional 14.7% |
| Immigrants | Turkey | 97.9 /100 | #79 | Exceptional 14.7% |
| Egyptians | 97.9 /100 | #80 | Exceptional 14.7% |
| Ukrainians | 97.7 /100 | #81 | Exceptional 14.7% |
| Macedonians | 97.6 /100 | #82 | Exceptional 14.7% |
| Immigrants | Italy | 97.4 /100 | #83 | Exceptional 14.8% |
| Soviet Union | 97.3 /100 | #84 | Exceptional 14.8% |
| Swiss | 97.2 /100 | #85 | Exceptional 14.8% |
| Australians | 97.2 /100 | #86 | Exceptional 14.8% |
| Finns | 97.2 /100 | #87 | Exceptional 14.8% |