Inupiat vs Immigrants from Argentina 5th Grade
COMPARE
Inupiat
Immigrants from Argentina
5th Grade
5th Grade Comparison
Inupiat
Immigrants from Argentina
98.4%
5TH GRADE
100.0/ 100
METRIC RATING
7th/ 347
METRIC RANK
97.3%
5TH GRADE
36.1/ 100
METRIC RATING
186th/ 347
METRIC RANK
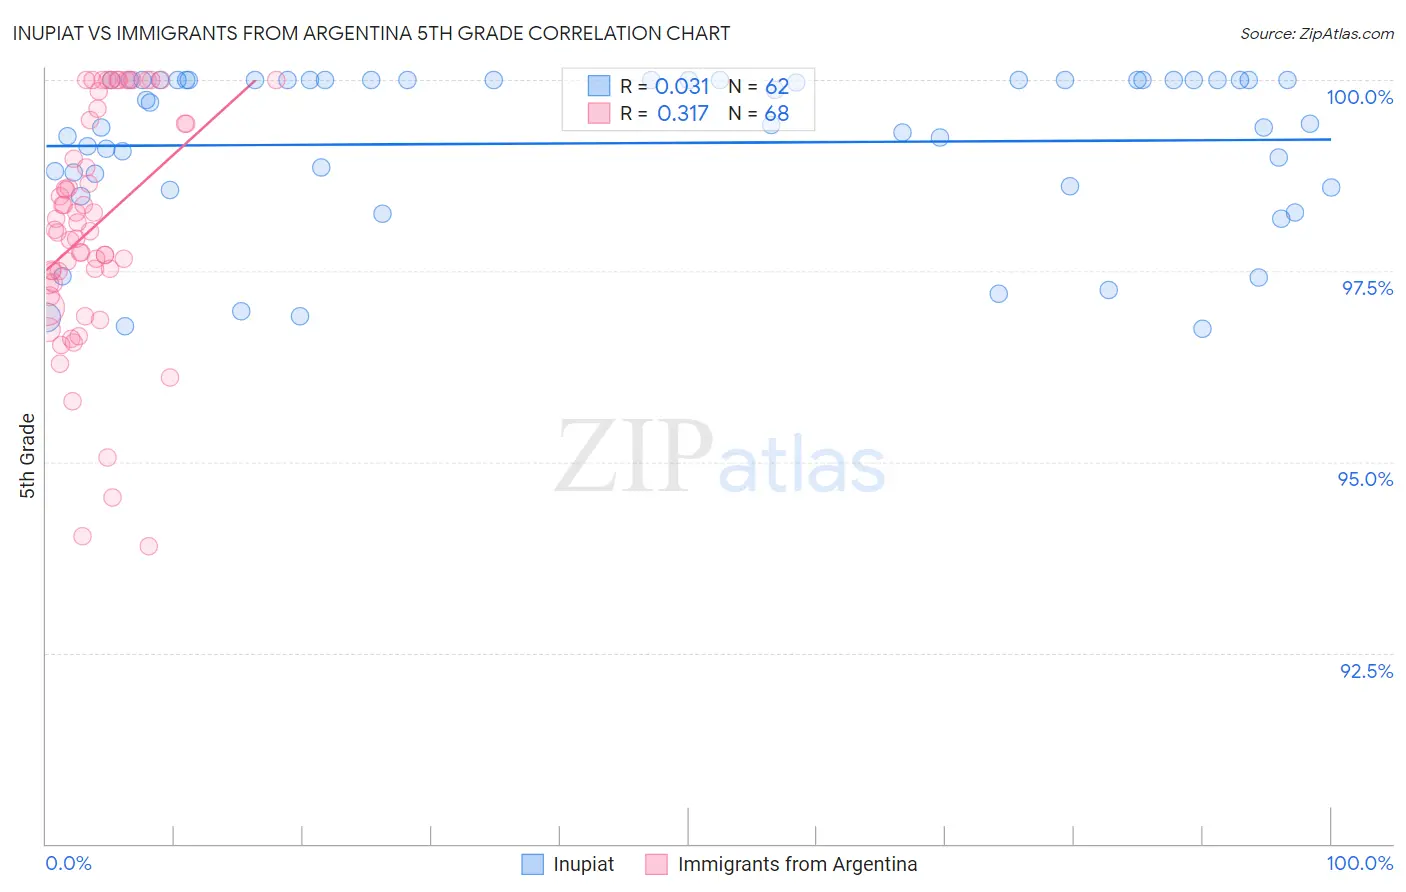
Inupiat vs Immigrants from Argentina 5th Grade Correlation Chart
The statistical analysis conducted on geographies consisting of 96,348,974 people shows no correlation between the proportion of Inupiat and percentage of population with at least 5th grade education in the United States with a correlation coefficient (R) of 0.031 and weighted average of 98.4%. Similarly, the statistical analysis conducted on geographies consisting of 264,434,317 people shows a mild positive correlation between the proportion of Immigrants from Argentina and percentage of population with at least 5th grade education in the United States with a correlation coefficient (R) of 0.317 and weighted average of 97.3%, a difference of 1.1%.
5th Grade Correlation Summary
| Measurement | Inupiat | Immigrants from Argentina |
| Minimum | 96.7% | 93.9% |
| Maximum | 100.0% | 100.0% |
| Range | 3.3% | 6.1% |
| Mean | 99.2% | 98.1% |
| Median | 99.6% | 98.0% |
| Interquartile 25% (IQ1) | 98.6% | 97.3% |
| Interquartile 75% (IQ3) | 100.0% | 99.5% |
| Interquartile Range (IQR) | 1.4% | 2.1% |
| Standard Deviation (Sample) | 1.0% | 1.5% |
| Standard Deviation (Population) | 1.0% | 1.5% |
Similar Demographics by 5th Grade
Demographics Similar to Inupiat by 5th Grade
In terms of 5th grade, the demographic groups most similar to Inupiat are Slovene (98.3%, a difference of 0.020%), Slovak (98.4%, a difference of 0.030%), German (98.4%, a difference of 0.030%), Norwegian (98.4%, a difference of 0.050%), and Tsimshian (98.4%, a difference of 0.050%).
| Demographics | Rating | Rank | 5th Grade |
| Crow | 100.0 /100 | #1 | Exceptional 99.5% |
| Welsh | 100.0 /100 | #2 | Exceptional 98.6% |
| Norwegians | 100.0 /100 | #3 | Exceptional 98.4% |
| Tsimshian | 100.0 /100 | #4 | Exceptional 98.4% |
| Slovaks | 100.0 /100 | #5 | Exceptional 98.4% |
| Germans | 100.0 /100 | #6 | Exceptional 98.4% |
| Inupiat | 100.0 /100 | #7 | Exceptional 98.4% |
| Slovenes | 100.0 /100 | #8 | Exceptional 98.3% |
| Swedes | 100.0 /100 | #9 | Exceptional 98.3% |
| English | 100.0 /100 | #10 | Exceptional 98.3% |
| Alaskan Athabascans | 100.0 /100 | #11 | Exceptional 98.3% |
| Carpatho Rusyns | 100.0 /100 | #12 | Exceptional 98.3% |
| Tlingit-Haida | 100.0 /100 | #13 | Exceptional 98.3% |
| Dutch | 100.0 /100 | #14 | Exceptional 98.3% |
| Scottish | 100.0 /100 | #15 | Exceptional 98.3% |
Demographics Similar to Immigrants from Argentina by 5th Grade
In terms of 5th grade, the demographic groups most similar to Immigrants from Argentina are Dutch West Indian (97.3%, a difference of 0.0%), Mongolian (97.3%, a difference of 0.010%), Immigrants from Ukraine (97.3%, a difference of 0.010%), Immigrants from Venezuela (97.3%, a difference of 0.010%), and Spanish American (97.3%, a difference of 0.010%).
| Demographics | Rating | Rank | 5th Grade |
| Immigrants | Kenya | 40.3 /100 | #179 | Average 97.3% |
| Pakistanis | 40.2 /100 | #180 | Average 97.3% |
| Argentineans | 39.5 /100 | #181 | Fair 97.3% |
| Mongolians | 39.4 /100 | #182 | Fair 97.3% |
| Immigrants | Ukraine | 38.6 /100 | #183 | Fair 97.3% |
| Immigrants | Venezuela | 38.4 /100 | #184 | Fair 97.3% |
| Dutch West Indians | 36.2 /100 | #185 | Fair 97.3% |
| Immigrants | Argentina | 36.1 /100 | #186 | Fair 97.3% |
| Spanish Americans | 34.7 /100 | #187 | Fair 97.3% |
| Paraguayans | 33.7 /100 | #188 | Fair 97.3% |
| Immigrants | Egypt | 32.9 /100 | #189 | Fair 97.3% |
| Blacks/African Americans | 31.8 /100 | #190 | Fair 97.3% |
| Immigrants | Brazil | 31.5 /100 | #191 | Fair 97.3% |
| Panamanians | 31.3 /100 | #192 | Fair 97.3% |
| Navajo | 29.0 /100 | #193 | Fair 97.2% |