Sierra Leonean vs Choctaw Female Poverty Among 18-24 Year Olds
COMPARE
Sierra Leonean
Choctaw
Female Poverty Among 18-24 Year Olds
Female Poverty Among 18-24 Year Olds Comparison
Sierra Leoneans
Choctaw
19.0%
FEMALE POVERTY AMONG 18-24 YEAR OLDS
98.7/ 100
METRIC RATING
96th/ 347
METRIC RANK
24.3%
FEMALE POVERTY AMONG 18-24 YEAR OLDS
0.0/ 100
METRIC RATING
314th/ 347
METRIC RANK
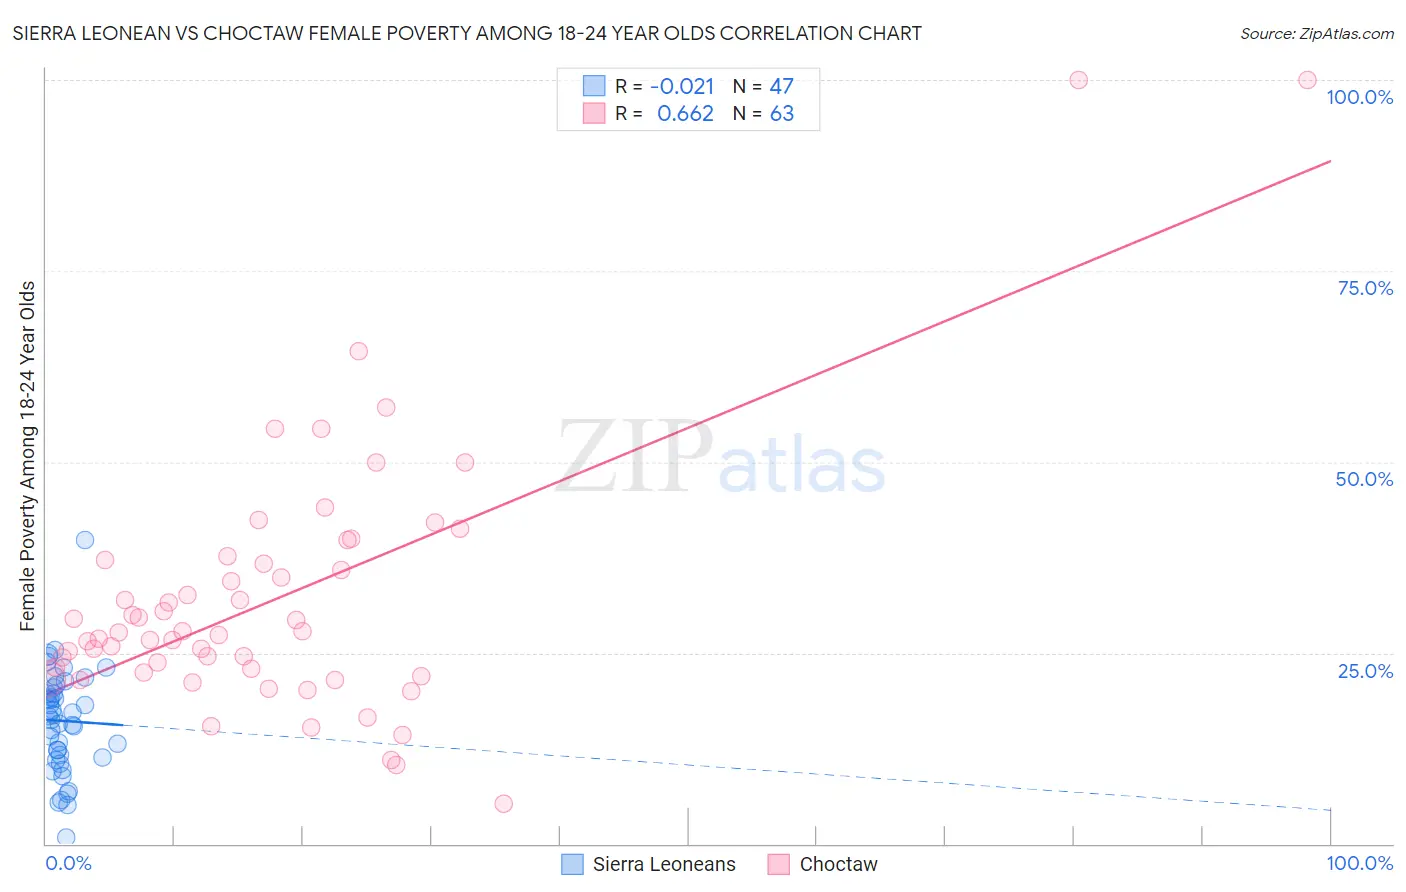
Sierra Leonean vs Choctaw Female Poverty Among 18-24 Year Olds Correlation Chart
The statistical analysis conducted on geographies consisting of 82,865,721 people shows no correlation between the proportion of Sierra Leoneans and poverty level among females between the ages 18 and 24 in the United States with a correlation coefficient (R) of -0.021 and weighted average of 19.0%. Similarly, the statistical analysis conducted on geographies consisting of 265,726,107 people shows a significant positive correlation between the proportion of Choctaw and poverty level among females between the ages 18 and 24 in the United States with a correlation coefficient (R) of 0.662 and weighted average of 24.3%, a difference of 27.4%.
Female Poverty Among 18-24 Year Olds Correlation Summary
| Measurement | Sierra Leonean | Choctaw |
| Minimum | 0.87% | 5.3% |
| Maximum | 39.8% | 100.0% |
| Range | 38.9% | 94.7% |
| Mean | 16.1% | 32.0% |
| Median | 16.7% | 27.7% |
| Interquartile 25% (IQ1) | 11.3% | 22.4% |
| Interquartile 75% (IQ3) | 20.5% | 37.2% |
| Interquartile Range (IQR) | 9.2% | 14.8% |
| Standard Deviation (Sample) | 6.9% | 17.0% |
| Standard Deviation (Population) | 6.8% | 16.8% |
Similar Demographics by Female Poverty Among 18-24 Year Olds
Demographics Similar to Sierra Leoneans by Female Poverty Among 18-24 Year Olds
In terms of female poverty among 18-24 year olds, the demographic groups most similar to Sierra Leoneans are Guamanian/Chamorro (19.0%, a difference of 0.10%), Ukrainian (19.0%, a difference of 0.17%), Haitian (19.0%, a difference of 0.23%), Filipino (19.0%, a difference of 0.26%), and Salvadoran (19.1%, a difference of 0.26%).
| Demographics | Rating | Rank | Female Poverty Among 18-24 Year Olds |
| Immigrants | Cabo Verde | 99.0 /100 | #89 | Exceptional 19.0% |
| Afghans | 99.0 /100 | #90 | Exceptional 19.0% |
| Romanians | 98.9 /100 | #91 | Exceptional 19.0% |
| Filipinos | 98.9 /100 | #92 | Exceptional 19.0% |
| Haitians | 98.9 /100 | #93 | Exceptional 19.0% |
| Ukrainians | 98.8 /100 | #94 | Exceptional 19.0% |
| Guamanians/Chamorros | 98.8 /100 | #95 | Exceptional 19.0% |
| Sierra Leoneans | 98.7 /100 | #96 | Exceptional 19.0% |
| Salvadorans | 98.4 /100 | #97 | Exceptional 19.1% |
| Immigrants | Jordan | 98.4 /100 | #98 | Exceptional 19.1% |
| Immigrants | Czechoslovakia | 98.3 /100 | #99 | Exceptional 19.1% |
| Chileans | 98.3 /100 | #100 | Exceptional 19.1% |
| Ecuadorians | 98.1 /100 | #101 | Exceptional 19.1% |
| Immigrants | Caribbean | 98.1 /100 | #102 | Exceptional 19.1% |
| Serbians | 98.0 /100 | #103 | Exceptional 19.1% |
Demographics Similar to Choctaw by Female Poverty Among 18-24 Year Olds
In terms of female poverty among 18-24 year olds, the demographic groups most similar to Choctaw are Creek (24.2%, a difference of 0.16%), Black/African American (24.3%, a difference of 0.20%), Alsatian (24.4%, a difference of 0.51%), Osage (24.5%, a difference of 0.81%), and Chickasaw (24.5%, a difference of 0.89%).
| Demographics | Rating | Rank | Female Poverty Among 18-24 Year Olds |
| Cree | 0.0 /100 | #307 | Tragic 23.4% |
| Immigrants | Sudan | 0.0 /100 | #308 | Tragic 23.5% |
| Blackfeet | 0.0 /100 | #309 | Tragic 23.6% |
| Comanche | 0.0 /100 | #310 | Tragic 23.6% |
| Potawatomi | 0.0 /100 | #311 | Tragic 23.7% |
| Yuman | 0.0 /100 | #312 | Tragic 24.0% |
| Creek | 0.0 /100 | #313 | Tragic 24.2% |
| Choctaw | 0.0 /100 | #314 | Tragic 24.3% |
| Blacks/African Americans | 0.0 /100 | #315 | Tragic 24.3% |
| Alsatians | 0.0 /100 | #316 | Tragic 24.4% |
| Osage | 0.0 /100 | #317 | Tragic 24.5% |
| Chickasaw | 0.0 /100 | #318 | Tragic 24.5% |
| Dutch West Indians | 0.0 /100 | #319 | Tragic 24.5% |
| Immigrants | Congo | 0.0 /100 | #320 | Tragic 24.6% |
| Immigrants | Zaire | 0.0 /100 | #321 | Tragic 25.1% |