Bermudan vs Choctaw Female Poverty Among 18-24 Year Olds
COMPARE
Bermudan
Choctaw
Female Poverty Among 18-24 Year Olds
Female Poverty Among 18-24 Year Olds Comparison
Bermudans
Choctaw
21.9%
FEMALE POVERTY AMONG 18-24 YEAR OLDS
0.1/ 100
METRIC RATING
282nd/ 347
METRIC RANK
24.3%
FEMALE POVERTY AMONG 18-24 YEAR OLDS
0.0/ 100
METRIC RATING
314th/ 347
METRIC RANK
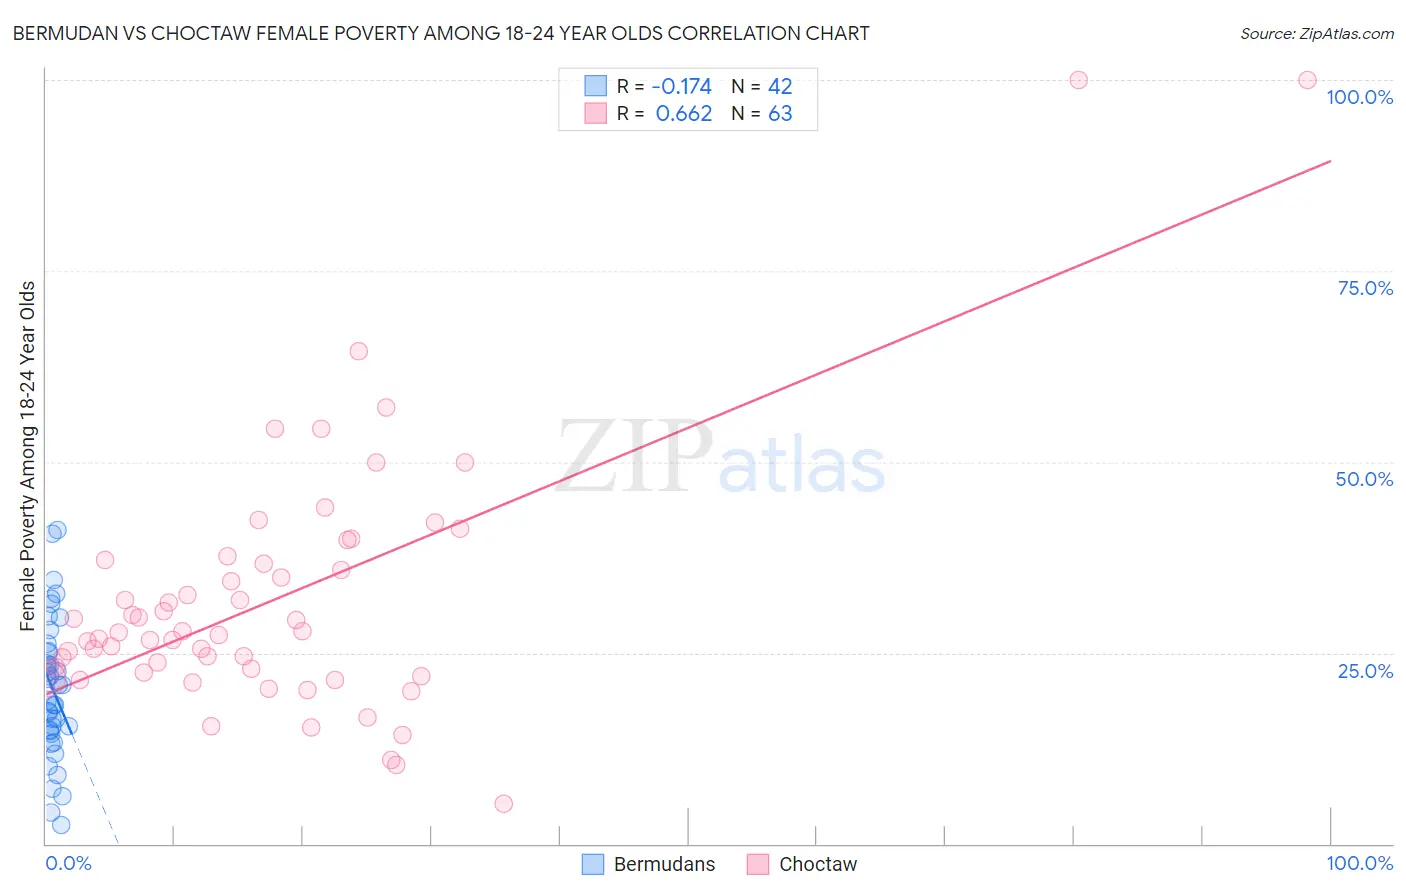
Bermudan vs Choctaw Female Poverty Among 18-24 Year Olds Correlation Chart
The statistical analysis conducted on geographies consisting of 55,519,020 people shows a poor negative correlation between the proportion of Bermudans and poverty level among females between the ages 18 and 24 in the United States with a correlation coefficient (R) of -0.174 and weighted average of 21.9%. Similarly, the statistical analysis conducted on geographies consisting of 265,726,107 people shows a significant positive correlation between the proportion of Choctaw and poverty level among females between the ages 18 and 24 in the United States with a correlation coefficient (R) of 0.662 and weighted average of 24.3%, a difference of 10.5%.
Female Poverty Among 18-24 Year Olds Correlation Summary
| Measurement | Bermudan | Choctaw |
| Minimum | 2.4% | 5.3% |
| Maximum | 41.1% | 100.0% |
| Range | 38.7% | 94.7% |
| Mean | 20.3% | 32.0% |
| Median | 19.8% | 27.7% |
| Interquartile 25% (IQ1) | 14.7% | 22.4% |
| Interquartile 75% (IQ3) | 25.1% | 37.2% |
| Interquartile Range (IQR) | 10.4% | 14.8% |
| Standard Deviation (Sample) | 9.1% | 17.0% |
| Standard Deviation (Population) | 9.0% | 16.8% |
Similar Demographics by Female Poverty Among 18-24 Year Olds
Demographics Similar to Bermudans by Female Poverty Among 18-24 Year Olds
In terms of female poverty among 18-24 year olds, the demographic groups most similar to Bermudans are Immigrants from Dominican Republic (21.9%, a difference of 0.090%), Immigrants from Dominica (21.9%, a difference of 0.13%), Spanish American (21.9%, a difference of 0.14%), Subsaharan African (22.0%, a difference of 0.30%), and Yaqui (21.9%, a difference of 0.31%).
| Demographics | Rating | Rank | Female Poverty Among 18-24 Year Olds |
| Immigrants | Bangladesh | 0.1 /100 | #275 | Tragic 21.8% |
| Bahamians | 0.1 /100 | #276 | Tragic 21.8% |
| Immigrants | Switzerland | 0.1 /100 | #277 | Tragic 21.8% |
| Yaqui | 0.1 /100 | #278 | Tragic 21.9% |
| Spanish Americans | 0.1 /100 | #279 | Tragic 21.9% |
| Immigrants | Dominica | 0.1 /100 | #280 | Tragic 21.9% |
| Immigrants | Dominican Republic | 0.1 /100 | #281 | Tragic 21.9% |
| Bermudans | 0.1 /100 | #282 | Tragic 21.9% |
| Sub-Saharan Africans | 0.0 /100 | #283 | Tragic 22.0% |
| Tlingit-Haida | 0.0 /100 | #284 | Tragic 22.0% |
| Ottawa | 0.0 /100 | #285 | Tragic 22.0% |
| Ugandans | 0.0 /100 | #286 | Tragic 22.1% |
| Immigrants | Middle Africa | 0.0 /100 | #287 | Tragic 22.1% |
| Dominicans | 0.0 /100 | #288 | Tragic 22.3% |
| French American Indians | 0.0 /100 | #289 | Tragic 22.3% |
Demographics Similar to Choctaw by Female Poverty Among 18-24 Year Olds
In terms of female poverty among 18-24 year olds, the demographic groups most similar to Choctaw are Creek (24.2%, a difference of 0.16%), Black/African American (24.3%, a difference of 0.20%), Alsatian (24.4%, a difference of 0.51%), Osage (24.5%, a difference of 0.81%), and Chickasaw (24.5%, a difference of 0.89%).
| Demographics | Rating | Rank | Female Poverty Among 18-24 Year Olds |
| Cree | 0.0 /100 | #307 | Tragic 23.4% |
| Immigrants | Sudan | 0.0 /100 | #308 | Tragic 23.5% |
| Blackfeet | 0.0 /100 | #309 | Tragic 23.6% |
| Comanche | 0.0 /100 | #310 | Tragic 23.6% |
| Potawatomi | 0.0 /100 | #311 | Tragic 23.7% |
| Yuman | 0.0 /100 | #312 | Tragic 24.0% |
| Creek | 0.0 /100 | #313 | Tragic 24.2% |
| Choctaw | 0.0 /100 | #314 | Tragic 24.3% |
| Blacks/African Americans | 0.0 /100 | #315 | Tragic 24.3% |
| Alsatians | 0.0 /100 | #316 | Tragic 24.4% |
| Osage | 0.0 /100 | #317 | Tragic 24.5% |
| Chickasaw | 0.0 /100 | #318 | Tragic 24.5% |
| Dutch West Indians | 0.0 /100 | #319 | Tragic 24.5% |
| Immigrants | Congo | 0.0 /100 | #320 | Tragic 24.6% |
| Immigrants | Zaire | 0.0 /100 | #321 | Tragic 25.1% |