Indian (Asian) vs Malaysian Child Poverty Among Girls Under 16
COMPARE
Indian (Asian)
Malaysian
Child Poverty Among Girls Under 16
Child Poverty Among Girls Under 16 Comparison
Indians (Asian)
Malaysians
13.3%
CHILD POVERTY AMONG GIRLS UNDER 16
99.9/ 100
METRIC RATING
22nd/ 347
METRIC RANK
17.8%
CHILD POVERTY AMONG GIRLS UNDER 16
5.7/ 100
METRIC RATING
214th/ 347
METRIC RANK
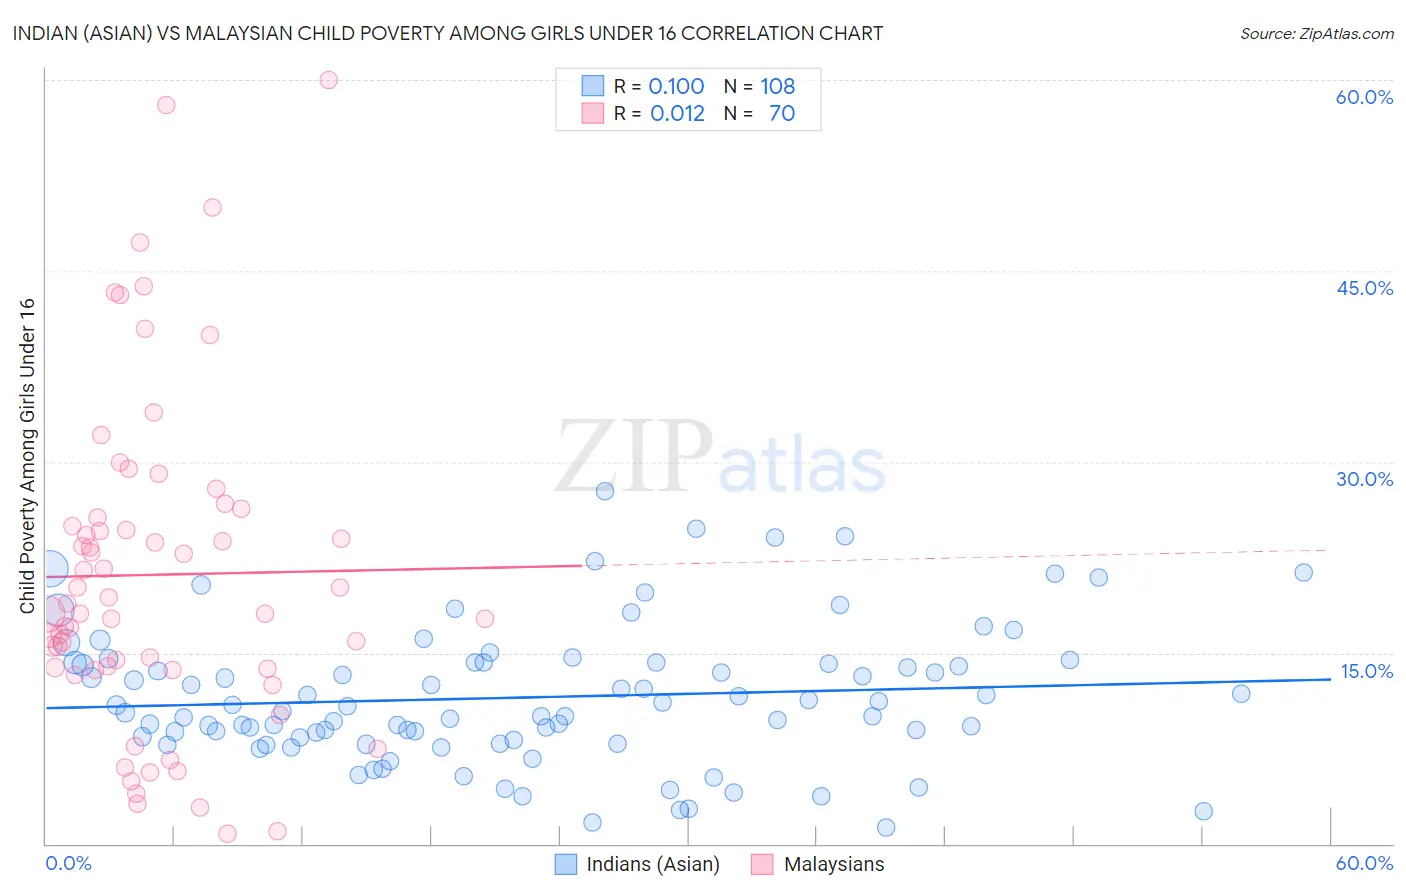
Indian (Asian) vs Malaysian Child Poverty Among Girls Under 16 Correlation Chart
The statistical analysis conducted on geographies consisting of 481,525,244 people shows a slight positive correlation between the proportion of Indians (Asian) and poverty level among girls under the age of 16 in the United States with a correlation coefficient (R) of 0.100 and weighted average of 13.3%. Similarly, the statistical analysis conducted on geographies consisting of 224,243,890 people shows no correlation between the proportion of Malaysians and poverty level among girls under the age of 16 in the United States with a correlation coefficient (R) of 0.012 and weighted average of 17.8%, a difference of 33.5%.
Child Poverty Among Girls Under 16 Correlation Summary
| Measurement | Indian (Asian) | Malaysian |
| Minimum | 1.3% | 0.81% |
| Maximum | 27.7% | 60.0% |
| Range | 26.3% | 59.2% |
| Mean | 11.5% | 21.1% |
| Median | 10.6% | 18.5% |
| Interquartile 25% (IQ1) | 8.3% | 13.8% |
| Interquartile 75% (IQ3) | 14.2% | 25.6% |
| Interquartile Range (IQR) | 6.0% | 11.8% |
| Standard Deviation (Sample) | 5.4% | 12.9% |
| Standard Deviation (Population) | 5.3% | 12.8% |
Similar Demographics by Child Poverty Among Girls Under 16
Demographics Similar to Indians (Asian) by Child Poverty Among Girls Under 16
In terms of child poverty among girls under 16, the demographic groups most similar to Indians (Asian) are Norwegian (13.3%, a difference of 0.17%), Assyrian/Chaldean/Syriac (13.3%, a difference of 0.20%), Immigrants from Eastern Asia (13.4%, a difference of 0.26%), Immigrants from Japan (13.3%, a difference of 0.32%), and Immigrants from China (13.4%, a difference of 0.72%).
| Demographics | Rating | Rank | Child Poverty Among Girls Under 16 |
| Okinawans | 99.9 /100 | #15 | Exceptional 13.0% |
| Immigrants | Lithuania | 99.9 /100 | #16 | Exceptional 13.1% |
| Bulgarians | 99.9 /100 | #17 | Exceptional 13.1% |
| Immigrants | Korea | 99.9 /100 | #18 | Exceptional 13.1% |
| Cypriots | 99.9 /100 | #19 | Exceptional 13.2% |
| Immigrants | Japan | 99.9 /100 | #20 | Exceptional 13.3% |
| Assyrians/Chaldeans/Syriacs | 99.9 /100 | #21 | Exceptional 13.3% |
| Indians (Asian) | 99.9 /100 | #22 | Exceptional 13.3% |
| Norwegians | 99.9 /100 | #23 | Exceptional 13.3% |
| Immigrants | Eastern Asia | 99.9 /100 | #24 | Exceptional 13.4% |
| Immigrants | China | 99.8 /100 | #25 | Exceptional 13.4% |
| Eastern Europeans | 99.8 /100 | #26 | Exceptional 13.5% |
| Latvians | 99.8 /100 | #27 | Exceptional 13.5% |
| Tongans | 99.8 /100 | #28 | Exceptional 13.6% |
| Bolivians | 99.8 /100 | #29 | Exceptional 13.6% |
Demographics Similar to Malaysians by Child Poverty Among Girls Under 16
In terms of child poverty among girls under 16, the demographic groups most similar to Malaysians are German Russian (17.8%, a difference of 0.0%), Pennsylvania German (17.8%, a difference of 0.020%), Moroccan (17.8%, a difference of 0.10%), Japanese (17.8%, a difference of 0.19%), and Immigrants from Thailand (17.7%, a difference of 0.28%).
| Demographics | Rating | Rank | Child Poverty Among Girls Under 16 |
| Hmong | 10.6 /100 | #207 | Poor 17.5% |
| Sierra Leoneans | 8.9 /100 | #208 | Tragic 17.6% |
| Panamanians | 8.7 /100 | #209 | Tragic 17.6% |
| Immigrants | Immigrants | 7.3 /100 | #210 | Tragic 17.7% |
| Immigrants | Eastern Africa | 6.4 /100 | #211 | Tragic 17.7% |
| Immigrants | Thailand | 6.3 /100 | #212 | Tragic 17.7% |
| Pennsylvania Germans | 5.7 /100 | #213 | Tragic 17.8% |
| Malaysians | 5.7 /100 | #214 | Tragic 17.8% |
| German Russians | 5.7 /100 | #215 | Tragic 17.8% |
| Moroccans | 5.5 /100 | #216 | Tragic 17.8% |
| Japanese | 5.3 /100 | #217 | Tragic 17.8% |
| Alaska Natives | 5.2 /100 | #218 | Tragic 17.8% |
| Immigrants | Panama | 4.7 /100 | #219 | Tragic 17.9% |
| Cubans | 4.1 /100 | #220 | Tragic 18.0% |
| Immigrants | Micronesia | 3.5 /100 | #221 | Tragic 18.0% |